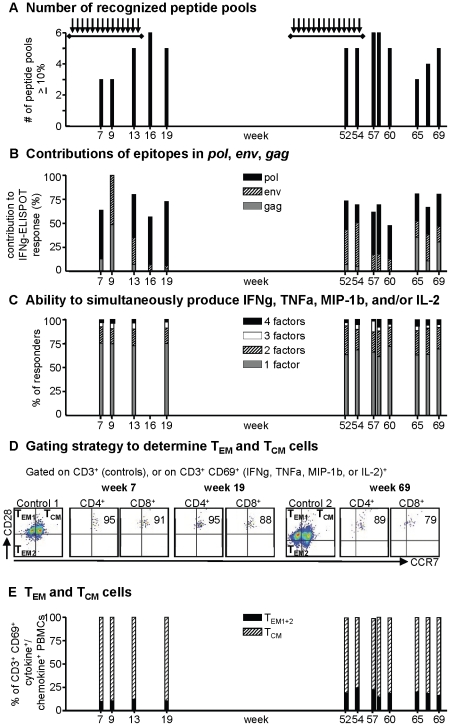
Figure 5. Epitope specificity and differentiation parameters of anti-SHIV T cells in chemo-vaccinated macaque 35451.
A: Number of recognized peptide pools: As a measure of the breadth of T cell diversity, the number of peptide pools recognized was examined. Only pools recognized with 10% or more of the anti-SHIV T cell ELISPOT response are shown. B: Contributions of epitopes in pol , env , gag : T cells to products of pol, env, and gag are depicted as percentage of the total IFNγ-ELISPOT response. C. Ability to simultaneously produce multiple cytokines/chemokines. Intracellular production of IFNγ, TNFα, MIP-1β, and/or IL-2 (“factors”) was measured by flow cytometry after gating on CD3+ CD69+ cells. Freeze-thawed PBMCs were cultured with 2 dominant peptide pools as determined by ELISPOT for each time point. We determined the number of cells that produced any of the factors (“responders”), and then analyzed whether the cells made any one factor alone, any two or three factors, or all four factors simultaneously. D. Gating strategy for determination of anti-SHIV effector and central memory T cells (TEM and TCM, respectively). Cells were stimulated as described in C. For the indicated control analyses, CD3+ gated cells were analyzed for CD28 or CCR7 expression, thus defining transitional TEM1, TEM2, and TCM quadrants for samples analyzed on the same day, i.e. from weeks 7 or 19 (control 1) or from week 69 (control 2). The same quadrants were applied to anti-SHIV T cells (CD3+, CD69+, and [IFNγ+, TNFα+, MIP-1β+, and/or IL-2]+), after further gating on CD4+ or CD8+ cells. The numbers in the upper right quadrants refer to TCM cells as percentage of anti-SHIV CD4+ or CD8+ cells. E: TEM (TEM1 and TEM2) and TCM cells are shown as percentage of anti-SHIV T cells (CD4+ or CD8+ cells), as determined by flow cytometry described in C and D. Arrows indicate virus exposures, horizontal bars depict PrEP treatment.

