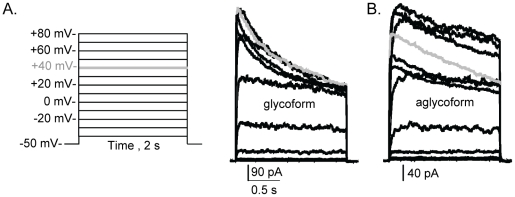
Figure 4. Ionic currents of the aglycoform inactivated to a lesser extent than glycoform.
Whole cell currents were elicited from the shown voltage protocol (A, left panel) for B35 cells expressing glycosylated (A, right panel) and unglycosylated (B) Kv3.1 proteins. Traces were scaled to show differences in inactivation kinetics. Grey lines denote currents at +40 mV.

