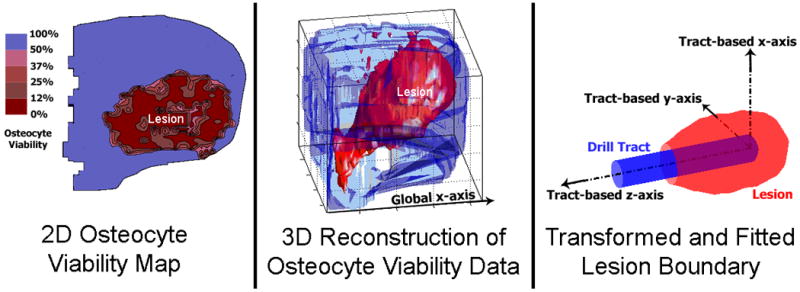
Figure 2.

Steps in the analysis of a cryoinsult-induced lesion. First, serial histology sections were evaluated for percentage of osteocyte viability in 2D (Left). Next, the fiducial markers were used to rotate and align adjacent sections for stacking in 3D (Middle). Finally, the necrotic lesion was isolated from the femoral head and transformed to a drill tract-based coordinate system. The fitted boundary was then used for lesion volume calculation (Right). The osteonecrotic lesion corresponds to the zone of <50% osteocyte viability.
