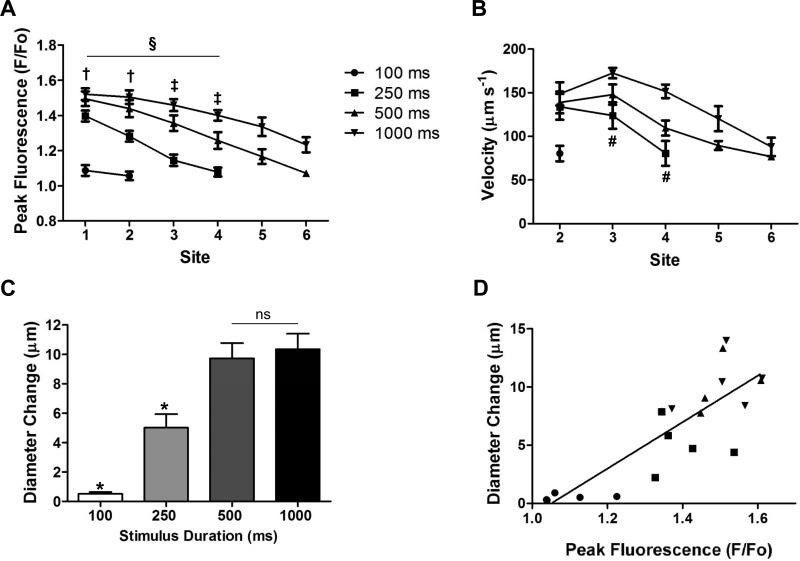
Figure 2.
Calcium fluorescence, ACh diffusion velocity and vasodilation. Experimental design and recording sites are as in Fig. 1B. A) With constant ejection current (500 nA), peak F/Fo and diffusion distance increased with ACh stimulus pulse duration (n=6). A 100 ms ACh pulse had negligible effect. In response to a 250 ms ACh pulse, the increase in F/Fo was not different from baseline beyond 75 μm (Site 4). § Peak F/Fo decreased with distance (Sites 1-4; P<0.01). † Significant difference between peak F/Fo in response to 250 ms vs. other stimulus durations (P<0.05). ‡ Significant difference between peak F/Fo responses among all stimulus durations (P<0.05). B) The velocity at which F/Fo spread along arterioles tended to decay with distance. Higher velocities occurred with longer stimulus durations. # Significant difference between 250 ms and 1000 ms (P<0.05). C) At the site of stimulation (Site 1), vasodilation increased with ACh pulse duration up to 500 ms and then plateaued. * Significantly different vs. other stimulus durations (P<0.05). ns, not significantly different. D) With spontaneous vasomotor tone, vasodilation at Site 1 increased with peak fluorescence across stimulus intensities (r2= 0.69; P<0.01).

