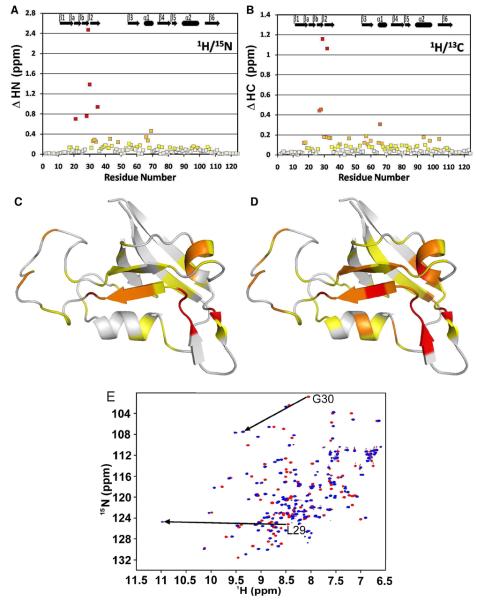
Figure 1.
(A) Combined 1H and 15N backbone amide chemical shift perturbations (ΔHN) are plotted as a function of residue number for GIP. (B) Combined HA and CA backbone chemical shift perturbations (ΔHC) are plotted as a function of residue number for GIP. (C) The magnitudes of HN presented in (A) are represented in different colors on a ribbon diagram of free GIP. White is < 0.1 ppm, yellow is < 0.2 ppm, orange is < 0.5 ppm and red is > 0.5 ppm. (D) The magnitudes of HC presented in (B) are represented as different colors on a ribbon diagram of free GIP. White is < 0.05 ppm, yellow is < 0.1 ppm, orange is < 0.2 ppm, red-orange is < 0.5 ppm and red is > 0.5 ppm. For (C) and (D) residues A11-Q112 are shown. Residues M1-T10 and A113-S124 are not shown since they are highly disordered and have chemical shifts perturbations of < 0.05 ppm. (E) An overlay of the HSQC spectra for free GIP (red) and the GIP-Glutaminase L peptide complex (blue). Arrows indicate the dramatic chemical shift perturbations of L29 and G30.

