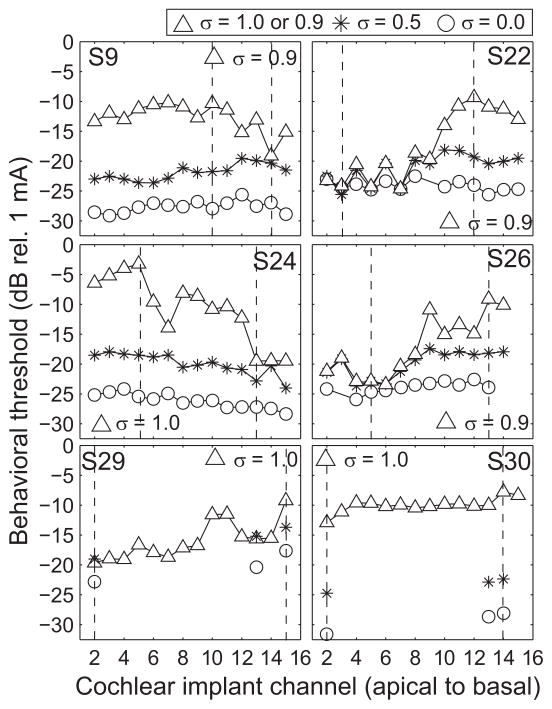
Figure 1.
Single-channel behavioral thresholds across subjects and configurations. Each panel plots the single-channel detection thresholds for a given subject (indicated in the top right corner). The abscissa represents cochlear implant channel from apical to basal and the ordinate represents detection threshold in decibels relative to 1 mA. Electrode configuration is indicated by symbols and for the triangles is either 0.9 or 1. The vertical dashed lines indicate the lowest and highest threshold channels obtained with the largest pTP fraction for each subject (0.9 for S9, S22, and S26 and 1.0 for S24, S29, and S30).

