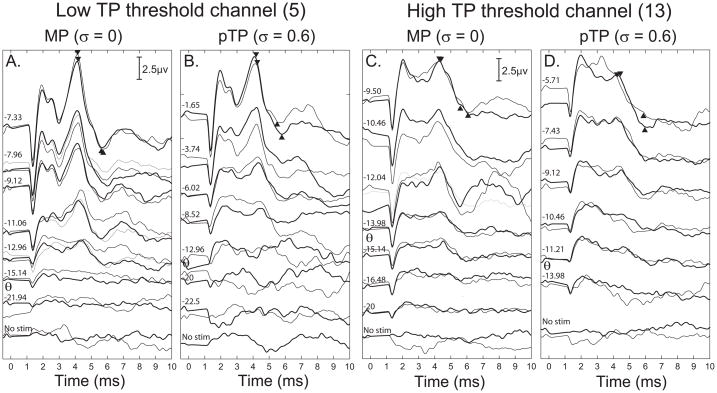
Figure 2.
Electrically-evoked auditory brainstem response (EABR) waveforms for the lowest (A, left two panels) and highest (B, right two panels) pTP threshold channels. The ordinate is response amplitude in μV and the abscissa is post-stimulus time in ms. Within each panel the EABR waveform is plotted with increasing stimulus levels from 0 current (bottom) to the most comfortable level (top) indicated at the left of each waveform. There are two waveforms plotted for each stimulus representing the replication of each waveform shown in black and grey lines. Within A and B, the left panels show responses to the MP configuration while the right panels show responses to pTP stimuli with a fraction of σ = 0.6. Data are from S26.

