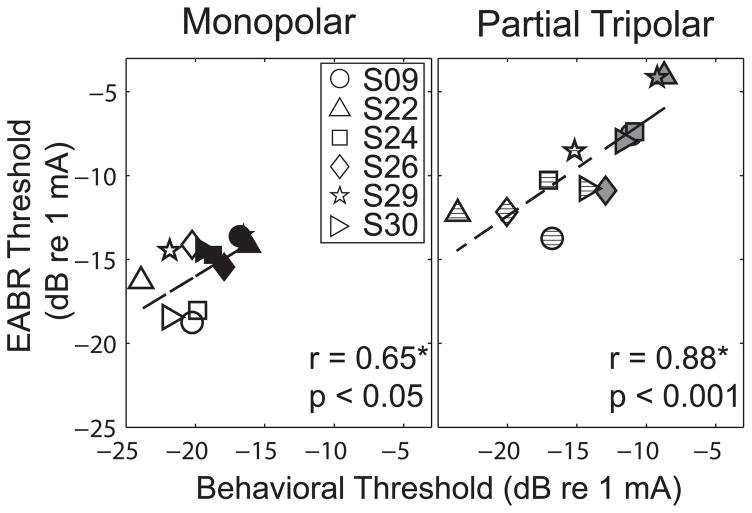
Figure 5.
Relation of behavioral threshold (abscissa) and EABR threshold (ordinate) for MP (left) and pTP (right) stimuli. As in previous figures, the symbol and fill of the data indicate the subject and the high or low threshold status of the channel, respectively. The solid line indicates a least-square error best fit line to the data. The statistics are based on the non-parametric Spearman’s rank correlation coefficient.

