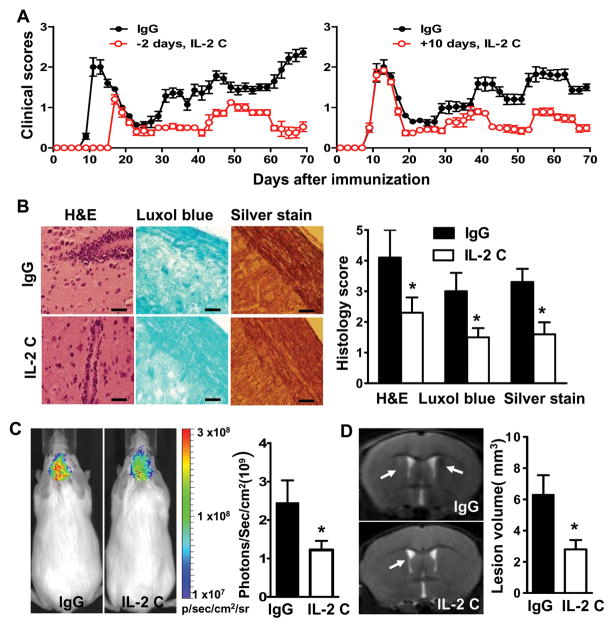
FIGURE 2. IL-2 complexes inhibit EAE activity and CNS pathology.
Mice were immunized with PLP/CFA and treated with IgG or IL-2 complexes (IL-2 C) prior to or after immunization. (A) EAE scores were recorded as mean clinical scores ± SD. Left panel denotes IL-2 C administration before or during EAE induction, n= 18–20 mice/group; right panel IL-2 C administration at day 10 p.i., n=6–8 mice/group. (B) Immunohistochemical analysis of intensity of infiltration, demyelination and axonal loss of spinal cords harvested at days 10–25 p.i. Results are representative of two experiments. (C) In vivo bioluminescence imaging analyses of brains at days 10–25 p.i. using Xenogen IVIS spectrum. Results are expressed as the region of interest (ROI) measurements of brain by Loess regression statistical analyses. (D) Visualization of brain demyelination with 7TMRI. Arrow heads indicate focal lesions located around the lateral ventricle and increased signal intensity on T2-weighted lesions. Pathology and imaging experiments were conducted in groups of mice (n= 4) between 10–25 days post immunization. Data are representative of two independent experiments (mean and s.e.m.). Scale bar, 100 μm. P values for clinical scores were evaluated by Mann-Whitney U test, all other comparisons between groups were analyzed by Student’s t-test for two groups and ANOVA for multiple comparisons; *p<0.05, **p<0.01.

