
Figure 4. The effect of chemotherapeutic agents on T24 sublines.
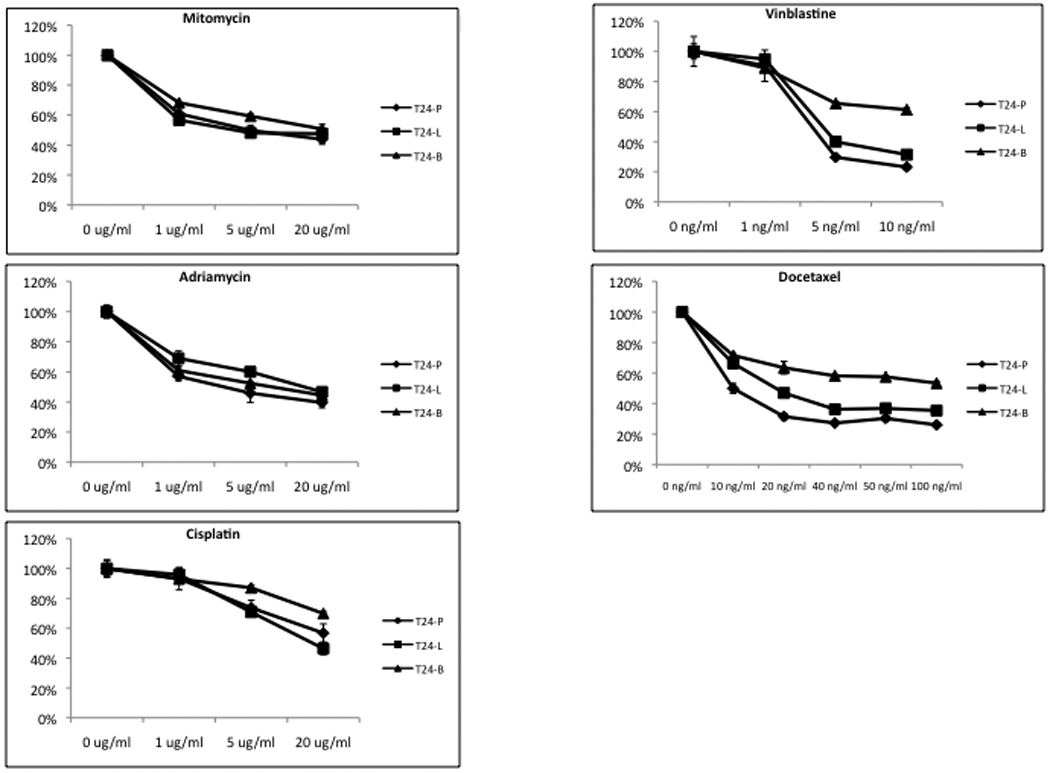
Cells were seeded in 48 well plates for 24 hours prior to adding drug. Relative cell number from each treatment (n = 4) was assessed using MTT assay was determined at Day 3 following drug treatment and the cell viability was calculated as percentage of control. The standard derivation of each data point is less than 10% of its mean.