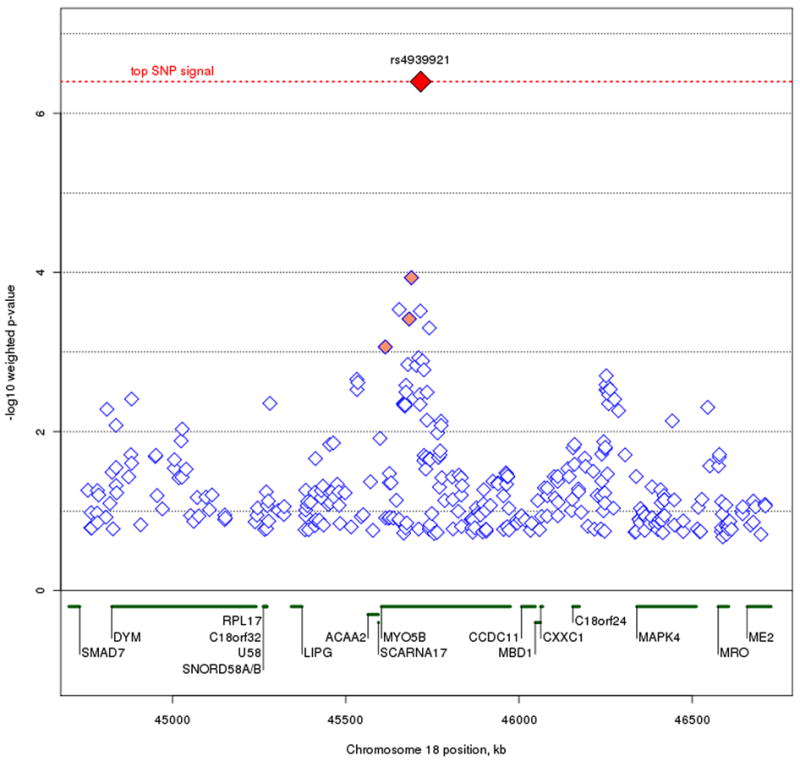
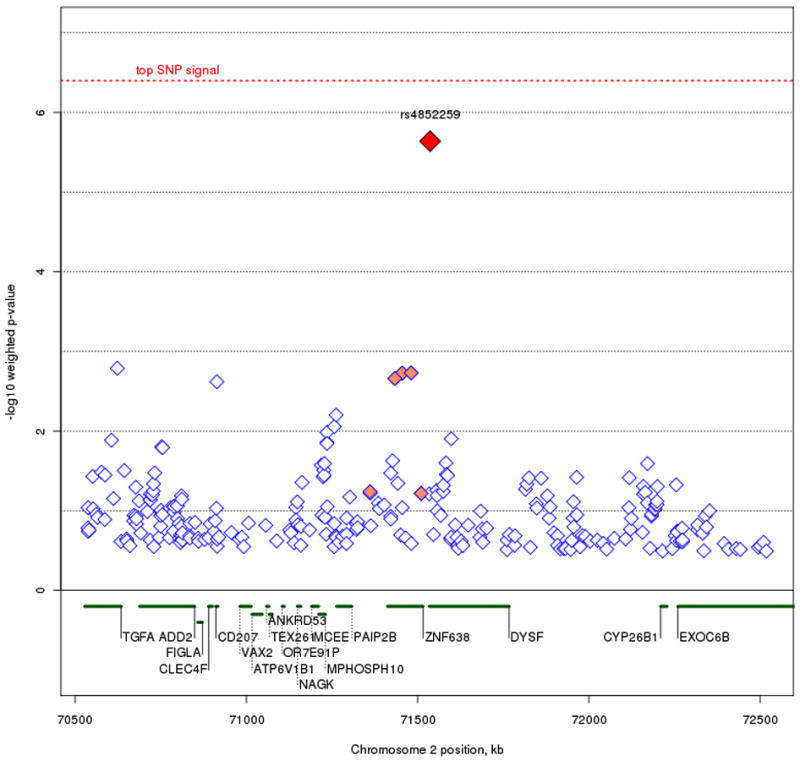
Figure 4A and B.


Plots of the top two regions of association. Figure 4A represents the MYO5B signal on chromosome 18q21.1-18q21.2. Figure 4B represents the DYSF signal on chromosome 2p13.3. The most associated SNP is marked in red. The color of the remaining SNPs reflects linkage disequilibrium (r2) with the most associated SNP (increasing red hue marks stronger r2). Gene regions are shown in green, and were taken from the March 2006 UCSC genome browser assembly.
