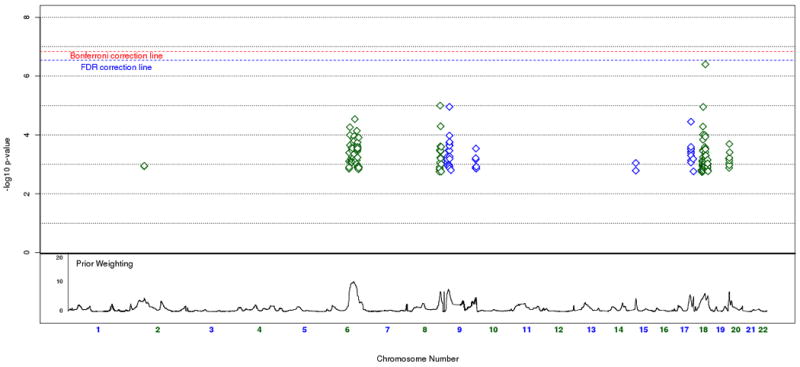
Figure 5.

Up-weighted regions of interest. Cumulative weighted association plot of all SNPs with an unweighted p-value above the 99th percentile and above the 95th percentile of linkage weights. Prior weighting is shown at the bottom of the plot. Significance after Bonferroni correction is shown in red, and significance after FDR correction at 0.1 is shown in blue.
