
Fig 2.
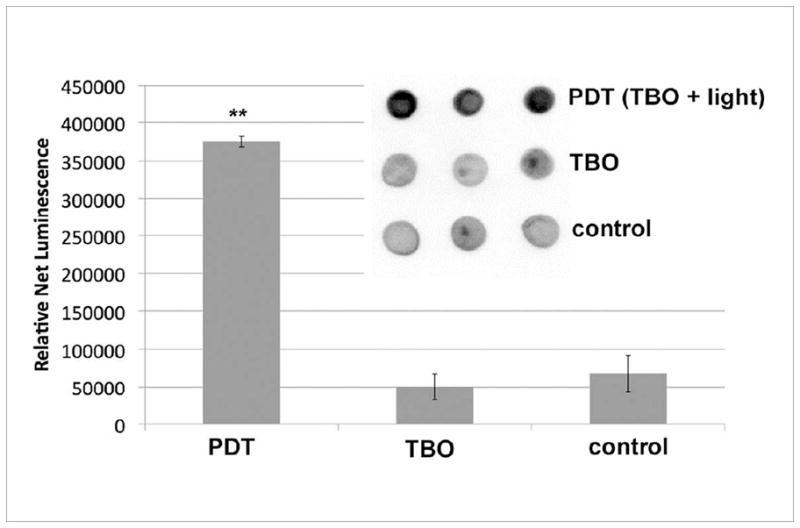
GroEL expression in E. coli 30 min after PDT. PDT consisted of 31.5 μM TBO and 13 J/cm2 of white light. 1) Results from triplicate dot blots of cell lysate with standard immunoblotting technique collected from a single experiment. 7 μg protein per dot, as determined by BCA assay. (2) Mean relative expression values as determined by densitometry; bars are SD; ** P <0.01 vs TBO and vs control (ANOVA).