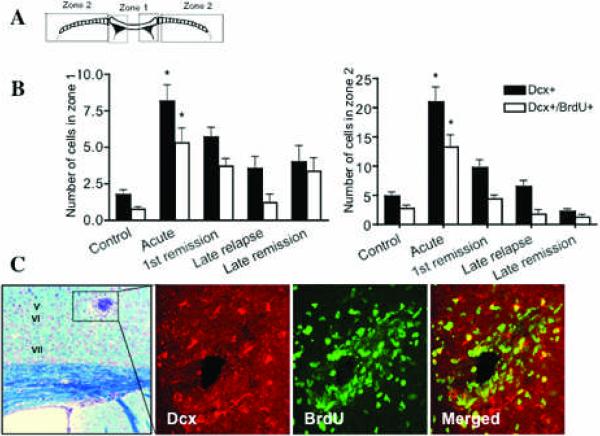
Figure 4. Neuroblast migration during EAE.
(A) Schematic diagram showing Zones 1 and 2 of he Corpus callosum. (B) Left panel: Intracortical lesion in cortical layer V (day 20 dpi), LFB staining with cresyl violet. High magnification of the lesion area stained with Dcx (red), BrDU (green) and the merged picture (right panel). (B) Quantification of migrating neuroblasts in zones 1 and 2 of the corpus callosum during EAE (*p<0.001 vs. control, n=6 mice/group), showing an increase in neuroblasts during the acute phase that is lost thereafter.

