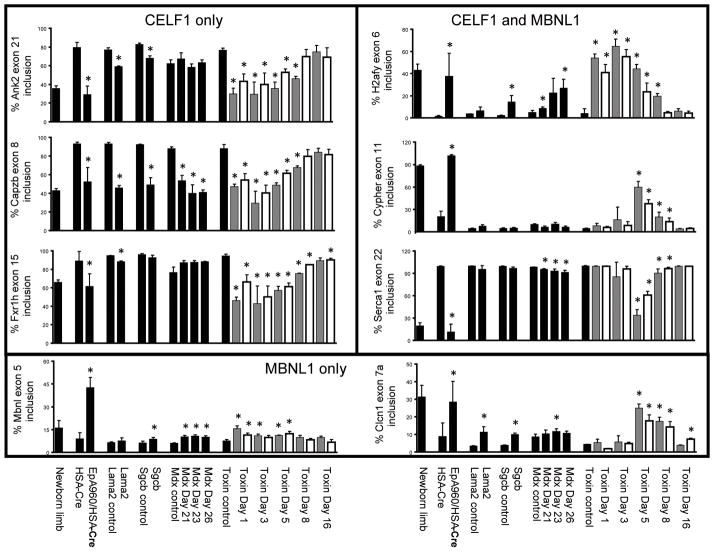
Figure 2. Splicing misregulation in several muscular dystrophy and muscle injury models.
RT-PCR was performed on RNA extracted from gastrocnemius muscle using primers that anneal to constitutive exons flanking the alternative exon (Supp Table 1). The percentage inclusion of alternative exons from eight genes (Ank2, Capzb, Fxr1h, H2afy, Mbnl1, Cypher, Serca1 and Clcn1) is graphically represented. Lanes are as follows: newborn limb, postnatal day 1 wild-type limb; HSA-Cre, HSA-Cre- ERT2 (+ tam) age matched; EpA960/HSA-Cre, EpA960/HSA-Cre-ERT2 (+ tam); Lama2 control, 129P1 wild-type age matched; Lama2, 129P1/ReJ-Lama2dy/J; Sgcb control, B6 wild-type age matched; Scgb, B6.129-Sgcbtm1Kcam/2J; mdx control, C57BL/6 wild-type age matched; mdx postnatal day 21, 23, and 26; toxin control, C57BL/6 wild-type age matched; toxin post injection day 1, 3, 5, 8 and 16 (gray bars are cardiotoxin, white bars are notexin). Each bar represents the mean of three or four biological replicates with standard deviation, except for the newborn sample, which represents the mean of three technical replicates from a pool of 12 animals. Differences in percent exon inclusion between the six models and their controls marked with (*) were determined to be statistically significant by the Student’s t test, P < 0.05.

