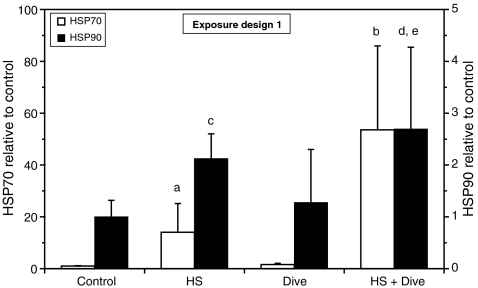
Fig. 3.
Expression of HSP70 and HSP90 in HUVEC after exposure to heat shock (HS) and simulated diving according to exposure design 1. The cells were harvested immediately after end of decompression and analyzed for immunodetectable HSP70. The results are shown as fold change relative to control. Data are from five separate experiments, and the results are given as the average ± SD of all the dishes within each treatment. HSP70: n = 19 (control, HS); n = 20 (dive); n = 12 (HS + dive). HSP90: n = 14 (control, HS); n = 9 (dive); n = 6 (HS + dive). a P < 0.05 vs. control, dive; b P < 0.001 vs. control, HS, dive; c P < 0.01 vs. control; d P < 0.001 vs. control; e P < 0.01 vs. dive

