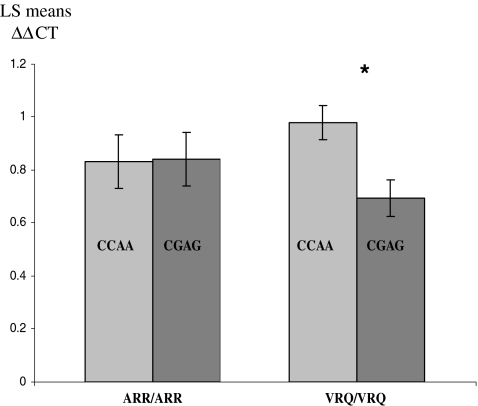
Fig. 1.
Expression results determined by real time PCR. The square means shown represent the relative amount of mRNA quantified in five ARR/ARR CC−660AA−528, five ARR/ARR CG−660AG−528, 15 VRQ/VRQ CC−660AA−528, and 16 VRQ/VRQ CG−660AG−528 animals maintained at permanent SC infected flock. *p < 0.05, statistically significant between VRQ/VRQ CC−660AA−528 and VRQ/VRQ CG−660AG−528 animals

