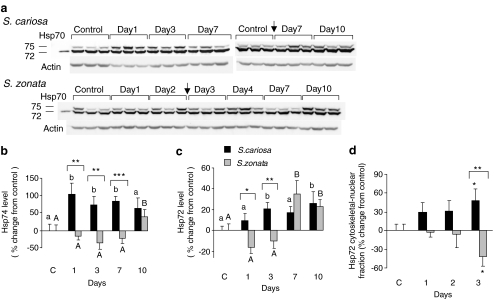
Fig. 2.
Expression of Hsp70 isoforms (Hsp72 and Hsp74) in the foot tissue of S. cariosa and S. zonata. Total protein was extracted from fully hydrated control and desiccated snails during 10 days of desiccation and subjected to Western blotting. a A representative blot for tissue lysate of three independent experiments is shown. Arrows denote the point of connection, where two consecutive gels were combined. b and c are graphical presentations of the relative levels of Hsp74 (b) and Hsp72 (c) in tissue lysates. n = 6–15 snails. Different letters above the bars denote significant differences within each species (lower case—S. cariosa; upper case—S. zonata). Asterisks denote significant differences between the two species (*p < 0.05; **p < 0.01; ***p < 0.001). d Relative levels of Hsp72 in the foot cytoskeletal–nuclear fraction. n = 7–8 snails. Asterisks denote significant differences within each species and also between the two species (*p < 0.05; **p < 0.01)

