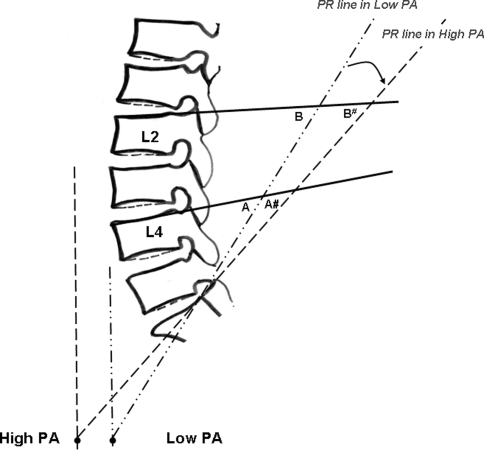
Fig. 3.
Drawing demonstrates the relationship between PA angle and pelvic radius measurements on lumbar spines (PR-L2, PR-L4 and PR-L5). The black dots represent the HA in high and low PA angles. The PR line in low PA angle is indicated by dash dotted lines and the dashed line is the High PA angle. The PR line was rearward projected as the PA angle was higher as indicated by curve arrow. The regional lumbar lordosis angles were then measured and decrease value even without the change of lumbar lordosis (PR-L4: A > A# and PR-L2: B > B#)

