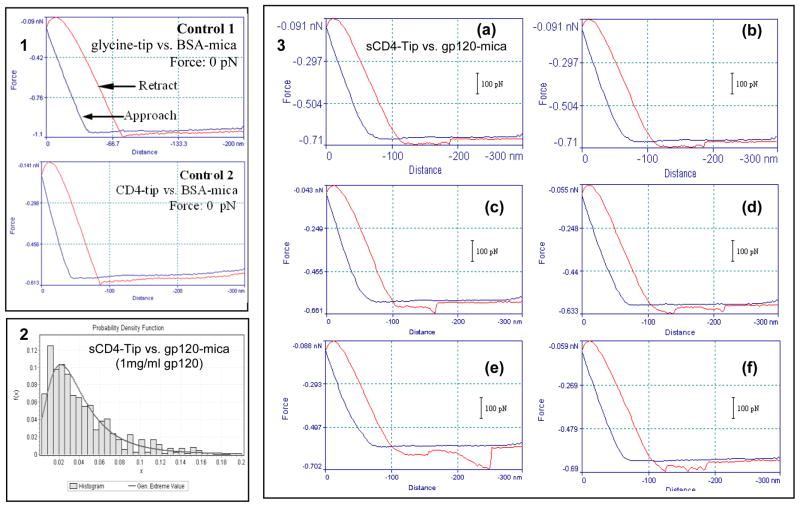
Fig. 1. AFM force measurements of the sCD4-gp120 interaction.
Panel 1: representatives of force-distance curves for control no specific interactions. Most glycine-BSA interactions (upper) and sCD4-BSA interactions (bottom) have a force of 0 pN as shown here; Panel 2: force histogram for interaction between sCD4 and gp120 (1 mg/ml). Generalized Extreme Value: 25.45 ± 20.46 pN; Mean value: 42.25 ± 34.14 pN (n=705). Panel 3: representatives of force-distance curves for sCD4-gp120 interaction. (a and b) the interaction force is 26 pN; (c) the interaction force is 55 pN which indicates the simultaneous unbinding of two sCD4-gp120 specific interactions; (d) there are two peaks (the force is 24 pN for the first peak and 28 pN for the other peak) displaying double interaction points which indicates the sequent unbinding of two sCD4-gp120 specific interactions; (e) the interaction force is 105 pN which indicates the simultaneous unbinding of 3–4 sCD4-gp120 specific interactions; (f) there are three peaks (the forces are 31, 21, and 35 pN, respectively) displaying three interaction points which indicate the sequent unbinding of three sCD4-gp120 specific interactions. All these force-distance curves are representative examples from a total of thousands of curves.

