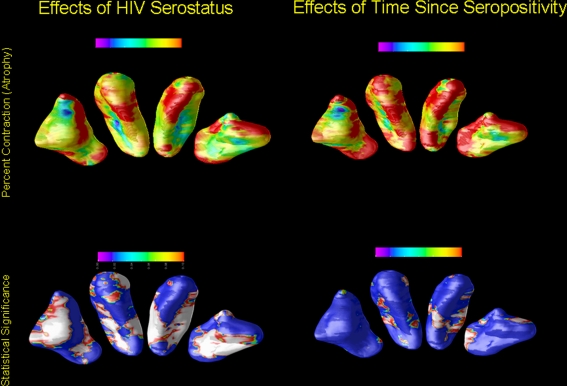
Fig. 1.
The regions of the CDT and PUT where the mean radial size of these structures was lower in the HIV-infected versus the control group. The images show the inferior surfaces of both the caudate and putamen in radiological orientation (i.e., looking towards the reader); the areas separated in the figure to ease viewing, and do not represent the actual spatial contiguity of the regions. The top row of the figure shows the areas of contraction as a function of serostatus (left) and time since first seropositivity (right). The areas of red have no significant contraction, and those with purple have ~15% contraction. The bottom row of the figure shows the local significance values from the test for group differences in the degree of atrophy for the CDT and PUT. Areas of dark blue have no significant change (by permutations testing) and those marked in white have highly significant effects (P’s < .01 and smaller)

