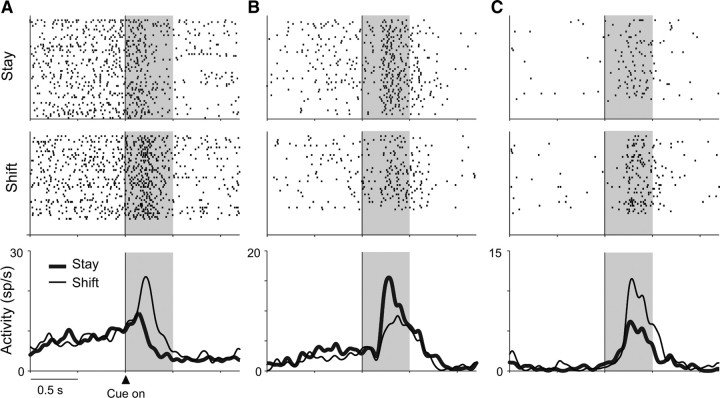
Figure 2.
Three examples of strategy-selective neurons. A–C, Neuron activity aligned on cue onset. Raster displays show spike times sorted chronologically from top to bottom with spike-density averages below each display. Stay (thick lines) and shift (thin lines) responses shown separately. Correct trials only. Background shading represents the cue period. A, PFdl neuron from monkey 2. B, PFo neuron from monkey 1. C, PFo neuron from monkey 2. sp/s, Spikes per second.

