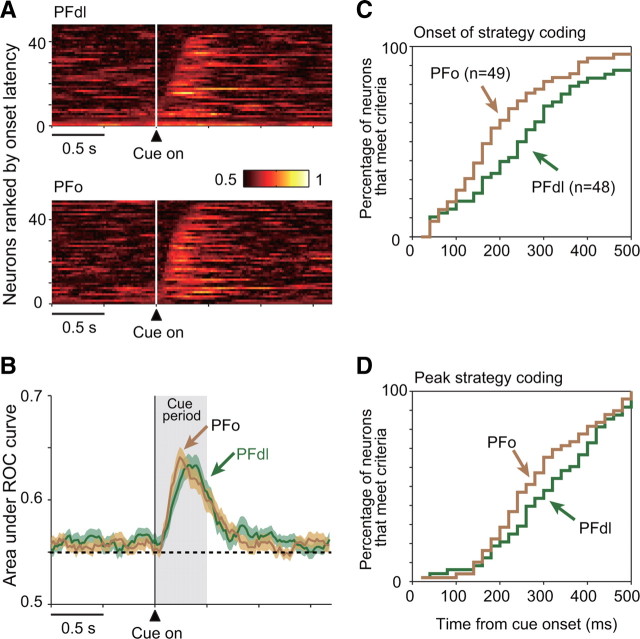
Figure 6.
A, Sliding ROC plots for PFdl (top) and PFo (bottom) neurons with strategy-selective activity during the cue period (as in Fig. 5A), with the area under the ROC curve color-coded for each cell, ranked according to the onset of strategy selectivity. B, Means with SEM (shading) for the data in A. C, Cumulative fraction of neurons meeting criteria for the onset of strategy selectivity from cue onset. D, Cumulative fraction of neurons reaching peak strategy encoding by ROC analysis.

