Figure 7.
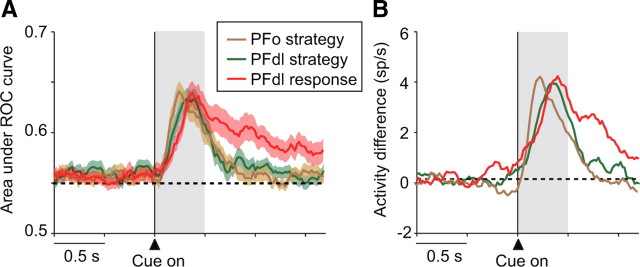
A, Sliding ROC plots for the response (left or right) chosen on each trial (red). This curve presents a measure of response coding in PFdl compared with the sliding ROC plots for strategy coding in PFdl (green) and PFo (brown) (see Fig. 6B). B, Response encoding in PFdl, measured by population activity means. Response coding is measured as the difference in activity between preferred and anti-preferred responses (red), plotted with the analogous difference means for strategy coding in PFdl (green) and PFo (brown) (see Fig. 5C).

