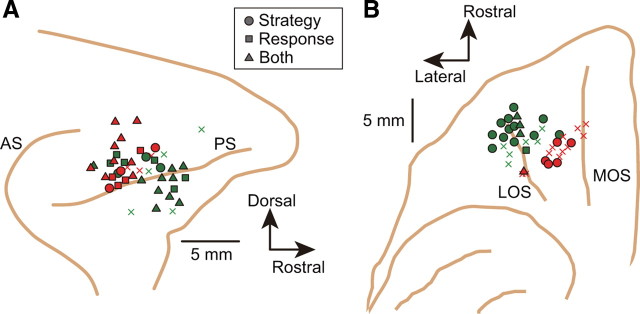
Figure 9.
Penetration sites. A, Penetration sites for PFdl recordings. Lateral view, composite of two monkeys. Each shape represents the site of an electrode array, which included four or more electrodes (green, monkey 1; red, monkey 2). Circles, squares, and triangles represent sites with one or more neurons showing strategy-selective cells, response-selective cells, or both, respectively. Xs mark penetration sites where none of the recorded neurons showed significant effects for either response or strategy. B, Penetration sites for PFo recording, data shown as in A. AS, Arcuate sulcus; PS, principal sulcus; MOS, medial orbital sulcus; LOS, lateral orbital sulcus.

