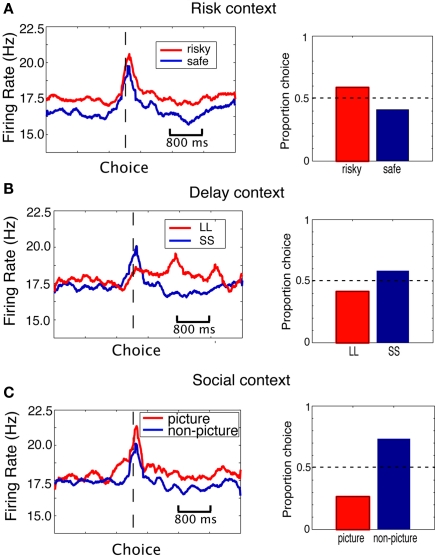
Figure 4.
The CGp population response increases when monkeys choose the risky, delayed, and social options – independent of preference. (A) Risk context. Population PSTH separated by whether the monkey chose the risky option (red) or the safe option (blue). On the right is proportion choice of the risky (red) and safe (blue) options. (B) Delay context. Population PSTH separated by whether the monkey chose the LL (red) or SS (blue) options. On the right is proportion choice of the LL (red) and SS (blue) options. (C) Social valuation context. Population PSTH separated by whether the monkey chose the picture option (red) or non-picture option (blue). On the right is proportion choice of the picture (red) and non-picture (blue) options.

