Abstract
DNA methylation constitutes the most stable type of epigenetic modifications modulating the transcriptional plasticity of mammalian genomes. Using bisulfite DNA sequencing, we report high-resolution methylation reference profiles of human chromosomes 6, 20 and 22, providing a resource of about 1.9 million CpG methylation values derived from 12 different tissues. Analysis of 6 annotation categories, revealed evolutionary conserved regions to be the predominant sites for differential DNA methylation and a core region surrounding the transcriptional start site as informative surrogate for promoter methylation. We find 17% of the 873 analyzed genes differentially methylated in their 5′-untranslated regions (5′-UTR) and about one third of the differentially methylated 5′-UTRs to be inversely correlated with transcription. While our study was controlled for factors reported to affect DNA methylation such as sex and age, we did not find any significant attributable effects. Our data suggest DNA methylation to be ontogenetically more stable than previously thought.
Introduction
The completion of the human genome project1,2 has created the basis to study how genetic information is executed at the cellular level. Many of the processes involved are governed by additional layers of epigenetic information that are not directly encoded by the DNA sequence itself but by chemical modifications of the chromatin in form of DNA methylation and histone modifications, collectively also referred to as the ‘epigenetic code’. Deciphering the human epigenetic code will be a daunting task as it is encoded not in a single but many different epigenomes (for review3,4).
Towards this goal, a blueprint for an international human epigenome project has recently been proposed5 that recognizes the need to integrate already on-going epigenome projects. One of these projects, termed the human epigenome project (HEP), aims to identify, catalogue and interpret genome-wide DNA methylation profiles of all human genes in all major tissues6. In mammals, DNA methylation occurs almost exclusively within the context of CpG dinucleotides with an estimated 80% of all CpG sites being methylated. While array-based approaches7,8,9 look promising for the future, bisulfite DNA sequencing10 remains the gold-standard for high (base pair) resolution DNA methylation profiling of human epigenome(s)6. Using this approach, we report here the methylation profiling of the human chromosomes 6, 20 and 22 in 43 samples derived from 12 different (healthy) tissues.
Results
Following the HEP pilot study6, we sought to establish DNA methylation reference profiles for three human chromosomes from a representative number of healthy (no known disease phenotype) human tissues and primary cells. The study was controlled for two parameters (age and sex) potentially influencing DNA methylation and comprised the analysis of 43 different samples derived from sperm, various primary cell types (dermal fibroblasts, dermal keratinocytes, dermal melanocytes, CD4+ and CD8+ lymphocytes) and tissues (heart muscle, skeletal muscle, liver and placenta). Tissues were pooled from up to three age- and sex-matched individuals (see Supplementary table 1 for details). Primary cells were cultured for no more than three passages to minimize the risk of introducing aberrant methylation. Additionally, the methylation levels of selected amplicons were compared before and after culturing and no difference in average methylation was detected.
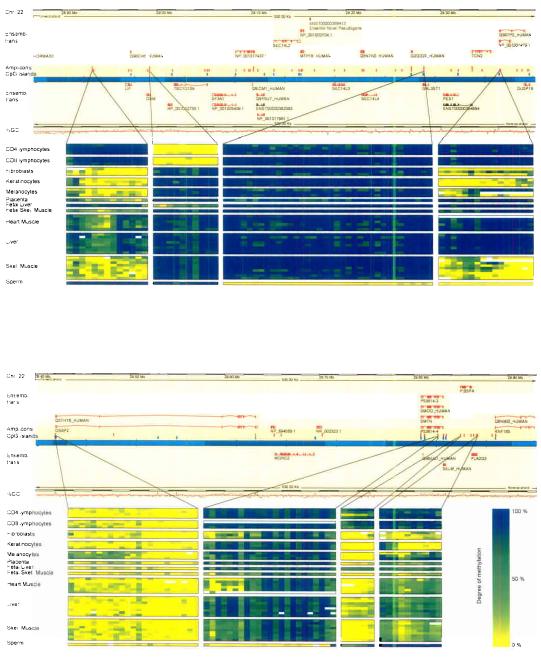
Amplicons were designed to cover 6 distinct sequence categories (Fig. 1) based on the Ensembl (NCBI34) annotation. CpG islands (CGIs) were not included as separate category because they were present in multiple categories but were analysed separately where indicated. In total, we analysed 2,524 amplicons on chromosomes 6, 20 and 22 (table1) comprising coding, non-coding and evolutionary conserved sequences that are associated with 873 genes. Taking the number of biological (Supplementary table 1) and technical (see Materials and Methods) replicates into account, we have determined the methylation status of 1.88 million CpG sites. The corresponding data have been deposited into the public HEP database and can be accessed at www.epigenome.org. Supplementary Fig. 1 shows a global view of the averaged methylation profiles of each tissue type for chromosomes 6, 20 and 22 and Fig. 2 (upper panel) shows a representative 1 Mb region on chromosome 22, illustrating short- and long-range amplicon coverage within the context of gene and CpG island annotation.
Figure 1. Type and distribution of amplicons.
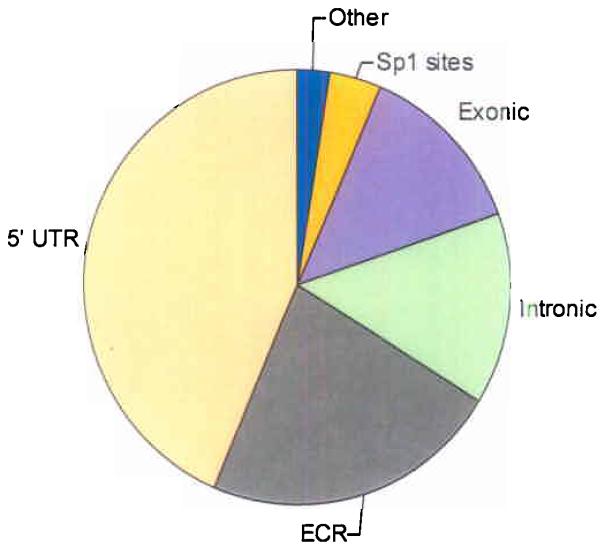
In total, 2,524 amplicons were analyzed from 6 distinct categories: 43.7% for 5′-untranslated regions (5′-UTR), 22.5% for evolutionary conserved regions (ECR), 14.3% for intronic regions (Intronic), 13.3% for exonic regions (Exonic), 3.6% for Sp1 transcription factor binding sites (Sp1) and 2.6% for Other. Details of the selection criteria for each category are described in Materials and Methods.
Table 1.
Summary statistics.
| Total | Chromosome 6 | Chromosome 20 | Chromosome 22 | |
|---|---|---|---|---|
| CpG islands on chromosome | 2,279 | 1,070 | 662 | 547 |
| CpG islands covered | 511 | 256 | 29 | 226 |
| CpG islands percentage covered | 22 % | 24 % | 4 % | 41 % |
| Genes covered | 873 | 383 | 89 | 401 |
| Exons covered | 853 | 454 | 23 | 376 |
| Introns covered | 920 | 465 | 118 | 337 |
| Number of tissues analyzed | 12 | |||
| Number of samples analyzed | 43 | |||
| Average length of amplicon +/− SD | 411 +/− 77bp | |||
| Average number of CpGs per amplicon | 16 +/− 10.8 | |||
| Total number of different amplicons | 2,524 | |||
| Number of C2Gs analyzed | 1,885,003 |
Figure 2. 1 Mb region on chromosome 22q12.2, illustrating amplicon coverage in the context of gene and CpG island annotation.
Examples of methylation profiles are shown for 8 amplicons and include examples of T-DMRs for genes of diverse functions (OSM, NP_0010001479.1, SMTN and RNF185) and examples of a hyper- (3rd profile from left) and an unmethylated (5th profile from left) CpG island. Rows represent different samples and are grouped according to tissue/cell type. Columns depict CpG sites and the corresponding methylation values are indicated by colour-code for each cell (blank cells indicate no data).
Distribution of methylation
In agreement with the results of the recently reported pilot study6, the majority of amplicons essentially displayed a bimodal distribution with 27.4% of loci being unmethylated (<20%), 42.4% being hypermethylated (>80%) and 30.2% displaying heterogeneous (20-80%) methylation. In agreement with previous studies (e.g.11,12,13), most of the CGIs were unmethylated (Supplementary Fig. 2) and only a small fraction (9.2%) of CGIs were hypermethylated. None of the CGIs with CpG densities greater than 10% were hypermethylated. As methylated cytosines are susceptible to spontaneous deamination14, it is conceivable that this level of CpG density might represent a threshold beyond which the mutagenic burden becomes too high for the (epi)genetic status to be stably maintained.
From the heterogeneously methylated loci, we selected 14 random amplicons and one control amplicon covering the imprinted GNAS115 locus to determine if the observed heterogeneity was caused by differences between cells (mosaicism) or parent-of-origin, allelic differences within cells (imprinting). Amplicons were subcloned and up to 20 clones were sequenced. Imprinting was confirmed for GNAS1 and mosaicism was confirmed for the rest. One amplicon worth noting in this context mapped to the 5′-UTR of SLC22A1, a gene located within the imprinted cluster of IGF2R on chromosome 616,17 but allele-specific methylation did not segregate with SNP rs1867351 (Supplementary Fig. 3), thus excluding imprinting in this case. Based on this analysis, we conclude that the majority (>90%) of the observed heterogeneous methylation is caused by mosaicism, although we cannot exclude the additional possibility of heterogeneous tissue sampling.
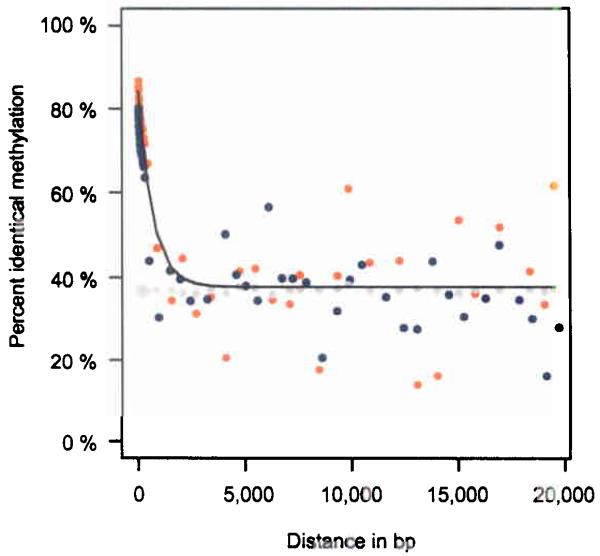
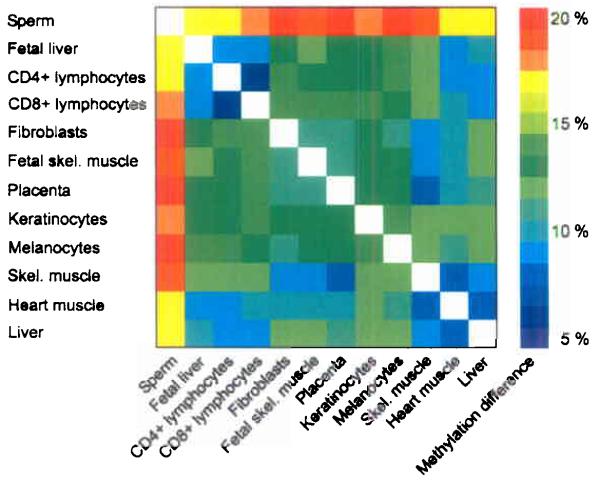
Next, we investigated the relationship between the degree of methylation over distance (co-methylation) and the difference in absolute methylation between tissues. Although a significant correlation could be established for co-methylation over short (up to 1,000 bp) distances, it deteriorated rapidly for distances larger than 2,000 bp (Fig. 3a). This finding suggests that – under normal (non-disease situation) circumstances - the level of local co-methylation is rather short-range as compared to long-range domains of homogenous methylation reported in some disease situations18,19. To assess the absolute differences in methylation between tissues we carried out pair-wise comparisons of all amplicons between the respective tissues (Fig. 3b). Sperm clearly stood out displaying the highest difference (e.g. up to 20% compared to fibroblasts and 10% compared to liver) while related tissues and cell types like CD4+ and CD8+ lymphocytes displayed the lowest differences (approximately 5%), consistent with their more similar gene expression profiles20. This accentuates the extensive reprogramming spermatozoids undergo during gametogenesis.
Figure 3.
(a) Correlation between co-methylation and spatial distance. Orange dots represent CpG methylation values aggregated and averaged over 25,000 individual measurements. Grey dots represent CpG methylation values based on re-sampling of random CpG positions. Blue dots indicate CpG methylation values based on re-sampling of amplicon positions. At distances larger than 1,000 bp no correlation between CpG methylation and spatial distance is detectable. (b) Absolute methylation differences between cell types/tissues. Absolute methylation differences of matched CpGs were determined by pair wise comparison. Differences are colour coded from blue to red indicating a 5% to 20% difference in methylation, respectively.
Promoter methylation
Promoters are key targets for epigenetic modulation but their exact locations remain unknown for most human genes. We therefore analysed three types of ‘promoter-proxy’ regions, including amplicons representative of the 5′-UTR in general and putative TSS and Sp1 sites (both also part of the 5′-UTR). The 5′-UTR amplicons were further subdivided according to CGI content and associated gene type (known gene, novel protein coding sequence (novel CDS), pseudogene or novel transcript), based on the annotation available from the vertebrate genome annotation (Vega) database21.
As expected, most (87.9%) of the CGI-containing 5′-UTR amplicons were unmethylated, while 2.1% were hypermethylated (>80%) and the remaining 10% displayed heterogeneous methylation(20-80%), Supplementary Fig. 4a, left panel). In contrast, almost 50% of the non CGI-containing 5′-UTRs displayed hypermethylation (>80%, Supplementary Fig. 4a, right panel) and only a minority (20.2%) were unmethylated (Supplementary Fig. 4a, left panel). When filtered for associated gene type, the percentage of unmethylated 5′-UTRs (<20%) was 56% for known genes, 53% for novel CDSs and about 12% for novel transcripts and pseudogenes (Supplementary Fig. 4b). Methylation has been implicated before in pseudogene silencing (e.g.13) and the methylation observed here for novel transcripts indicates a similar fate for this category.
Transcription start sites (TSSs) can be predicted with good specificity22 and offer higher spatial resolution than 5′-UTRs. Averaging of the methylation values of CpGs surrounding TSSs revealed an unmethylated core region of about 1,000 bp, extending symmetrically upstream and downstream of the TSS (Fig. 4). As unmethylated loci are generally associated with open chromatin structure (e.g. reviewed in23), the methylation status of the identified core region might reflect an open chromatin structure that extends downstream of the TSS.
Figure 4. CpG methylation at transcription start sites (TSSs).
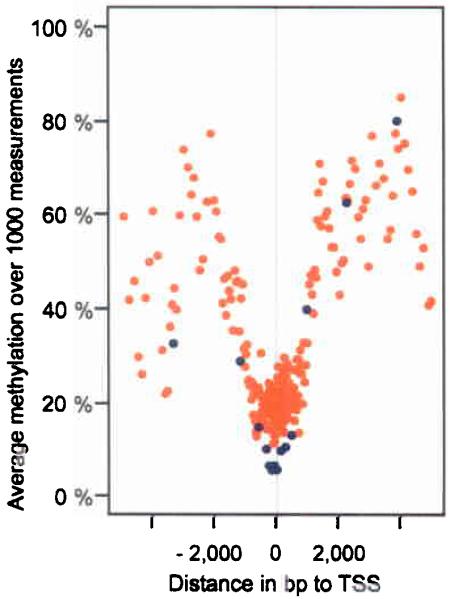
CpG methylation values were binned (each bin containing 1,000 values), averaged and plotted according to their relative distance to the TSS (orange dots). Blue dots represent bins containing Sp1 sites identified previously by Cawley et al.24. Centered on the TSS, a symmetric core of about 1,000 bp is unmethylated.
For the analysis of individual transcription factor binding sites, we selected 94 amplicons containing experimentally verified Sp1 binding sites on chromosome 22 that were previously identified by Cawley et al.24. Of these, 46 were selected to be TSS-associated (within +/− 1,000 bp of a TSS) and 48 to be not TSS-associated (>1,000 bp away from nearest TSS). Averaging the methylation values for each of the 94 amplicons over all 43 samples, revealed that 31% were hypermethylated (>80%), 25% were heterogeneously methylated (20-80%) and 44% were unmethylated (<20%), indicating that Sp1 binding might be independent of methylation. However, if amplicons were filtered for TSS association, very different ratios of hyper:heterogeneous:no methylation emerged: 9:11:80% for TSS-associated compared to 52:40:8% for non TSS-associated amplicons. Similarly, averaging over individual CpG sites revealed that 76% of all TSS-associated CpGs were unmethylated (<20%) compared to only 14% when not TSS-associated (Fig. 4, blue dots). To investigate this further, we correlated amplicon methylation with the presence/absence of a known Sp1 motif (Sp1_Q6) extracted from the TRANSFAC database and found a significant correlation (p=0.017), e.g. amplicons with the 25 highest motif scores are less likely to have high methylation scores. Taken together, these findings bestow highest confidence for Sp1 binding to occur at unmethylated and TSS-associated Sp1 sites but do not exclude the possibility of Sp1 binding at hypermethylated and/or non TSS-associated sites. In some model systems, Sp1 binding has been shown to be abolished by site-specific methylation25,26, while in other systems it appears methylation independent27,28. A direct comparison with the Cawley et al. data is not possible as this study used cell lines and, therefore, the methylation at the respective amplicons could be different from the one we have observed in our samples.
Age- and sex-dependent DNA methylation
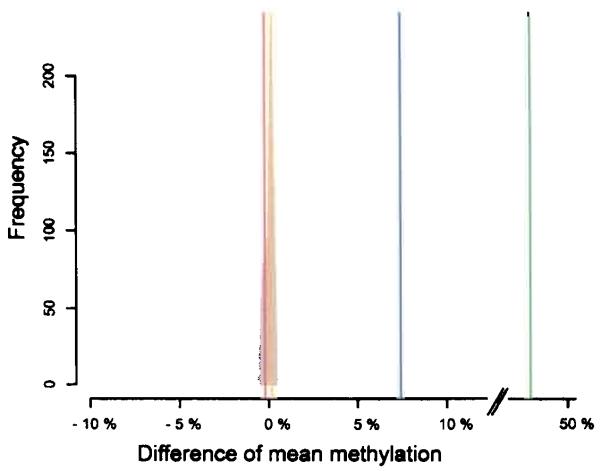
DNA methylation is influenced by a number of endogenous and exogenous parameters3. Here, we have analysed our data for potential differences associated with age and sex. For a number of different tissues (liver, skeletal muscle, heart muscle) we examined samples obtained from two age groups, one group having a mean age of 26 (SD +/− 4) years and the second group having a mean age of 68 (SD +/− 8) years. By averaging the methylation difference of all CpGs analyzed for the two age groups, we identified a mean methylation difference of only 0.275% between these two age groups (Fig. 5, red line) and a difference of 0.1% between males and females (Fig. 5, yellow line). These differences are unlikely to be significant as 10,000-fold re-sampling of the corresponding data showed similar or larger differences in these random cases (Fig. 5, grey area). In contrast, by comparing the average methylation between different cell types (Fig. 5, blue line), we detected highly significant differences between e.g. CD4+ lymphocytes and dermal fibroblasts (7.1%) and between skeletal muscle and liver (4.0%).
Figure 5. Global DNA methylation and age/sex.
Differences of mean methylation were determined in three tissues (heart muscle, skeletal muscle, liver) for two age groups (group 1: 26 years, SD +/− 4 years and group 2: 68 years, SD +/− 8 years, red line), males/females (orange line) and two different primary cells (CD4+ lymphocytes, dermal fibroblasts, blue line). As control, tissues were re-sampled (10,000-fold) for both age groups and their mean methylation differences were calculated (grey area). The same control was carried out for sex-specific differences and similar results were obtained (data not shown). As positive control for sex-specific methylation, an X-chromosomal gene (ELK1) was used that displays the expected methylation difference of about 50% (green line). While the 7.1% difference between primary cells (blue line) is highly significant, the respective differences of 0.275% and 0.1% between age groups (red line) and sex (orange line) fall within the differential range observed for the control (grey area) and are therefore not significant.
While the above analysis of all CpGs has power to detect global changes in average methylation levels, it might be less suitable to identify specific loci showing a correlation of methylation with age. We therefore re-analysed each amplicon in our data set to identify age-correlated differential methylation at individual loci. This approach also allowed to detect differences smaller than 50% but, again, no locus displayed differential methylation that reached statistical significance (p<0.05).
Similarly, we compared samples from the same age group but differing in sex to identify putative non X-chromosomal changes in methylation. Conducting both a global and candidate amplicon analysis, we did not detect any significant methylation changes associated with sex. As a positive control, we confirmed differential 5′-UTR methylation of ELK1, a X-chromosomal gene that is differentially methylated displaying 50% and 0% methylation respectively in female and male samples. The absence of both, global and locus-specific changes in age- and sex-correlated methylation in our data set suggests that, in healthy individuals, such alterations are limited to specific loci and tissues. A potential caveat of all age-correlated methylation studies (including ours) is the possible heterogeneity of tissue samples that have an inherent higher degree of heterogeneity than primary cells due to the different cell-types constituting a given tissue which in turn determines the average level of DNA methylation. In the present study, we pooled DNA samples in order to minimize errors introduced by heterogeneous tissue sampling. It is conceivable that some tissues, e.g. those more exposed to environmental conditions such as lung and colon, will show a stronger correlation between methylation and age. A recent study performed in monozygotic twins detected epigenetic differences in the overall content and distribution of 5-methylcytosine and histone acetylation that arose in older twins29 and it is possible that age-related methylation alterations might be too subtle to be detectable on a genome-wide scale against the heterogeneous genetic background of the used samples and/or the method used.
Differential methylation
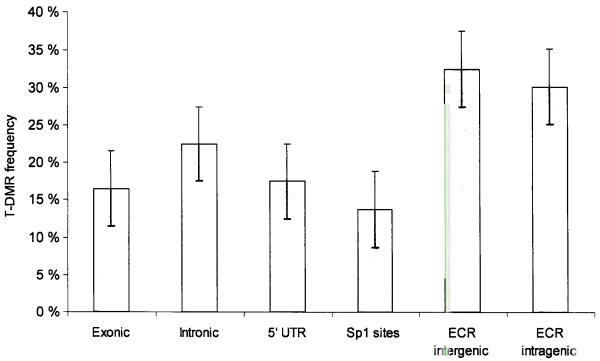
It is believed that tissue-specific transcription is, in part, controlled by tissue-specific differentially methylated regions (T-DMRs). T-DMRs are likely to be important regulatory elements that are essential for specifying tissue type identity in mammals, however, we are currently aware of a handful, mostly CGI-associated T-DMRs in a few tissues only (for review see30). Hierarchical clustering of our data revealed that biological replicates of each tissue type clustered together (Supplementary Fig. 5), indicating the presence of tissue-specific methylation profiles. Approximately 22% of the amplicons were T-DMRs (p < 0.001; table S2). These were located within 5′-UTRs, exons, and introns of functionally diverse genes (Fig. 2, lower panel for examples; Supplementary table 2). Within the 5′-UTR, T-DMRs located within a CGI (Supplementary Fig. 6) were strongly underrepresented (13% vs. 87%, χ2 test, p <0.001). The comparatively low frequency of CGI-associated T-DMRs is consistent with previous reports using restriction landmark genome scanning (RLGS)31,32. We also identified a number of amplicons (JAG1, Supplementary table 2) that were differentially methylated in fetal tissues when compared to their adult counterparts, emphasizing the importance of epigenetic mechanisms during mammalian development. Interestingly, T-DMRs were also found to be associated with both unprocessed and processed pseudogenes (e.g. CMHA and AC000078.2-002, respectively), and evolutionary conserved, non-protein coding regions (ECRs). In fact, we found T-DMRs are strongly over-represented in ECRs (χ2 test, p <0.005) and 30% of all examined ECRs were T-DMRs compared to a T-DMR frequency of 17% identified in 5′-UTRs and exons (Fig. 6a). Some of the T-DMR ECRs were located up to 100 kb away from the nearest annotated gene which is consistent with putative long-range regulatory effects associated with enhancer or silencer function but, on the other hand, could also indicate the presence of as yet unkown genes. These findings support the notion that T-DMRs may play a functional role beyond the mere control of transcription via promoter methylation. For instance, comparative analysis of the mouse IL4 locus identified two ECRs that undergo differential methylation during differentiation from naïve CD4 to TH1 and TH2 cells and can act as enhancers for IL4 expression (reviewed in33).
Figure 6.
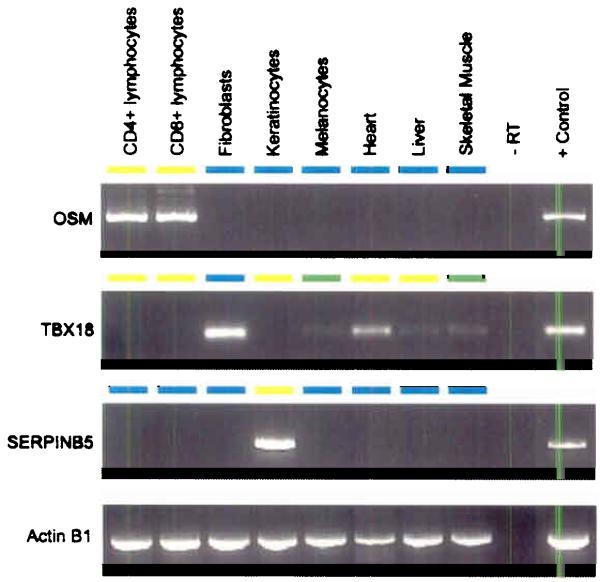
(a) Relative proportion of putative T-DMRs. Normalized for the number of amplicons in each category, the proportion of T-DMRs was highest in ECRs, both intergenic and intragenic ECRs while T-DMRs located within 5′-UTRs have a lower frequency of occurrence (b) Correlation between 5′-UTR methylation and mRNA expression. Representative results are shown for 2 genes. Expression was determined for 43 genes and one positive control (ACTINB1) in 8 tissues/cell types using reverse transcriptase (RT) PCR. Total RNAs derived from mixed tissues and cell lines were used as positive control. Differential 5′-UTR methylation is inversely correlated with mRNA expression for OSM and SERPINB5 (for which the inverse correlation was previously known) but not for TBX18. The colour code depicts the degree of 5′-UTR methylation for each gene (yellow ≈ 0% methylation, green ≈ 50% and blue ≈ 100% methylation).
Transcriptional silencing by promoter methylation is one of the major mechanisms for tumour suppressor gene silencing and neoplastic transformation34. Few genes have been found to be regulated by promoter methylation in healthy tissues35 with one example being SERPINB536 where 5′-UTR methylation correlates with the silencing of mRNA expression. We randomly selected 43 genes associated with 5′-UTR T-DMRs and 10 genes that contained T-DMRs within the gene, and determined mRNA expression by reverse transcriptase PCR (RT-PCR). Of the 5′-UTR T-DMRs, the methylation state did not correlate with mRNA expression levels for 63% of the genes and inversely correlated for 37% (examples for both scenarios are shown in Fig. 6b). Interestingly, genes without a CGI in their respective 5′-UTRs (e.g. oncostatin (OSM), fig 2, fig. 6b) also displayed an inverse correlation, indicating that genes with a low CpG density might be subject to transcriptional regulation via DNA methylation as well. None of the T-DMRs located within genes displayed a correlation with expression of the cognate mRNA. These observations suggest that differential 5′-UTR methylation might only play a permissive role such as establishing an open chromatin conformation in some cases. In this model, other additional factors, such as transcription factors or histone modifications, would be missing to drive transcription. Alternatively, the examined T-DMRs might not be located in the region that regulates transcription.
Conservation of DNA methylation
The conservation of DNA sequences between species is well studied but much less is known about cross-species conservation of DNA methylation. To determine, if and to what degree DNA methylation is conserved between species, we compared the methylation profiles of 59 orthologous amplicons (as far as can be ascertained by conserved synteny and sequence similarity) in four human and mouse tissues (skin, liver, heart muscle, skeletal muscle). The amplicons were located either within 5′-UTRs or within ECRs. As shown in Fig. 7, the majority (69.4%) of profiles were conserved (differing by less than 20%) in both amplicon categories, e.g. in both species we observed methylation of about 90% in the 5′-UTR of RIN2 in liver while other tissues were consistently unmethylated. Only 4.3% of the orthologous loci differed by more than 60%, indicating that these amplicons were differentially hyper- or unmethylated in the two species. One such example is the 5′-UTR amplicon of gene Q6ZRW2 which was approximately 60% methylated in human and unmethylated in the corresponding mouse tissues. Based on this analysis, we extrapolate that about 70% of orthologous loci between human and mouse may have conserved (differing by less than 20%) DNA methylation profiles. This finding adds further evidence to the concept that many epigenetic states may be evolutionarily conserved between mammals. A recent study already showed that epigenetic histone modifications are strongly conserved between human and mouse even though many of the corresponding sites were not conserved at the DNA level37.
Figure 7. Conservation of methylation between human/mouse orthologous amplicons.
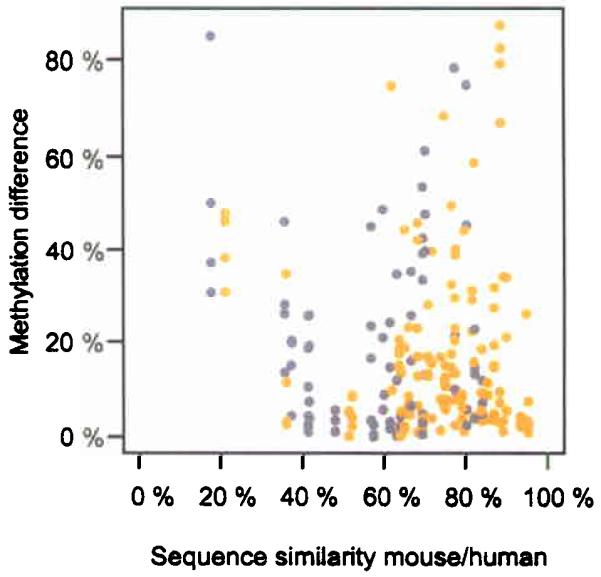
59 orthologous amplicons (37 ECRs (yellow) and 22 5′-UTRs (grey)) were analyzed in four tissues (skin, skeletal muscle, heart muscle and liver) from both species. The majority (69.4%) of ECR and 5′-UTR amplicons differed by less than 20% methylation, indicating significant conservation. Both, hyper- and unmethylated amplicons showed a similar degree of methylation conservation (data not shown).
Discussion
The generation of a DNA methylation reference map of the human genome represents an important contribution towards the elucidation of the human epigenetic code. The present study reveals new insights on how DNA methylation contributes to the epigenetic plasticity of the human genome and demonstrates that large-scale and quantifiable DNA methylation analysis at the ultimately desirable single base pair resolution is possible using the sequencing infrastructure established for the human genome project. Similar to the ENCODE38 and HAPMAP39 resources, the availability of a high-resolution DNA methylation resource adds another information layer to the annotation and understanding of chromatin which defines the functional state of the human genome. The HEP and other epigenome projects can further be expected to be invaluable for the discovery of novel epigenetic diagnostics and drugs40, the monitoring of drug efficacy41 and the development of a truly integrated (epi)genetic approach42 to common disease.
Material & Methods
Cell and Tissue samples
Tissue samples were obtained from one of the following sources: Asterand, (Detroit, US), Pathlore Plc. (Nottingham, UK), Tissue Transformation Technologies (T-cubed, Edison, US), Northwest Andrology (Missoula, US), NDRI (Philadelphia, US) and Biocat GmBH (Heidelberg, Germany). Only anonymized samples were used and ethical approval was obtained for the study. Contamination by blood cells is estimated to be low as blood specific methylation profiles were not detected in the tissues. Human primary cells were obtained from Cascade Biologics (Mansfield, United Kingdom), Cell Applications Inc. (San Diego, United States), Analytical Biological Services Inc. (Wilmington, US), Cambrex Bio Science (Verviers, Belgium) and from the DIGZ (Berlin, Germany). Dermal fibroblasts, keratinocytes and melanocytes were cultured according to the supplier’s recommendations up to a maximum of 3 passages reducing the risk of aberrant methylation due to extended culturing. As an additional control we compared the average methylation of selected amplicons obtained from dermal fibroblasts, keratinocytes and melanocytes with the methylation of the same loci in additional human skin samples. No significant deviation between the methylation of the primary cells and tissues were detected, indicating that cell culturing for a limited number of passages does not change DNA methylation. CD4+ T-lymphocytes were isolated from fresh whole blood by depletion of CD4+ monocytes followed by a negative selection. CD8+ cells were isolated from fresh whole blood by positive selection. Subsequent FACS analysis confirmed a purity of CD4+/CD8+ T-lymphocytes greater than 90%. In some cases, DNA samples were pooled according to the sex and age of the donors. All genders were confirmed by sex-specific PCR.
Amplicon selection and classification
Amplicons were selected and classified based on Ensembl22,43 (build NCBI 34) annotation. 5′-UTR: Overlapping by at least 200 bp with or within core region of 2,000 bp upstream to 500 bp downstream of the TSS. Where multiple sites were annotated per gene, the first annotated TSS was used. Exonic: Greater than 50% and at least 200 bp of amplicon overlapping with annotated exon. Intronic: Greater than 50% and at least 200 bp of amplicon overlapping with annotated intron. ECR: ≥70% DNA sequence similarity (including ≥4 CpGs) for at least 100 bp between human and mouse non-coding sequences. Out of 3,249 ECRs identified on chromosome 20, 290 intergenic and 206 intronic (496 in total) ECRs were selected. Sp1: Overlapping with putative Sp1 sites identified by ChIP-chip analysis24. Other: amplicons that are not located within a gene or a 5′-UTR and additionally do not belong to any other category. CGI were classified based on the criteria by Gardiner-Garden and Frommer44 with the modification that CGIs had to have a minimum length of 400 bp as opposed to 200 bp as longer CGIs are less frequently associated with Alu repeats45.
DNA extraction, PCR amplification and sequencing
DNA was extracted using the Qiagen DNA Genomic-tip kit according the manufacturer’s recommendation. After quantification, DNA was bisulfite converted as previously described46. Bisulfite-specific primers with a minimum length of 18bp were designed using a modified primer-3 program. The target sequence of the designed primers contained no CpGs allowing amplification of both un- and hypermethylated DNAs. All primers were tested for their ability to yield high quality sequences. Primers that gave rise to an amplicon of the expected size using non-bisulfite treated DNA as a template were discarded, thus ensuring the specificity for bisulphite-converted DNAs. Primers were also tested for specificity on bisulfite DNA by electronic PCR. DNA amplification was set up in 96-well plates using an automated pipeline as described previously6. PCR amplicons were quality controlled by agarose gel electrophoresis, re-arrayed into 384-well plates for high-throughput processing, cleaned up using ExoSAP-IT (USB Corporation, Cleveland, Ohio) to remove any excess nucleotides and primers and sequenced directly in the forward and reverse directions. Some PCR amplicons were subcloned into pGEM vector (Promega, Madison, USA) and up to 20 clones were picked for sequencing. Sequencing was performed on ABI 3730 capillary sequencers using 1/32nd dilution of ABI Prism BigDye terminator V3.1 sequencing chemistry after hotstart (96°C for 30 seconds) thermocycling (92°C for 5 seconds, 50°C for 5 seconds, 60°C for 120 seconds × 44 cycles) and ethanol precipitation. PCR fragments were sequenced using the same PCR amplification primers. Trace files and methylation signals at a given CpG site were quantified (estimated sensitivity >20% difference in methylation) using the ESME software as previously described47. The software used for the analysis of all loci described in this manuscript is freely available at www.epigenome.org. The bisulfite sequencing-based approach chosen here allows to measure DNA methylation with high reproducibility and accuracy, as independent measurements are derived from both the sense and antisense strands of a PCR amplicon (R = 0.87; N = 557,837). In addition, about 4.1% of the amplicons were subjected to independent PCR amplification and sequencing. These technical replicates also displayed high correlation (R = 0.9; N = 15,655). Furthermore, the signal is independent of the position of the measured CpG within the amplicon, which is supported by high correlation between measurements of the same CpGs in overlapping amplicons (R = 0.85; N = 91,528).
RNA extraction and RT-PCR
Aliquots of the same samples of the human melanocytes, keratinocytes, fibroblasts, CD4+ and CD8+ cells that were used for methylation analysis were used for RNA analysis. Primary cell cultures (maximum of 3 passages) of human melanocytes, keratinocytes and dermal fibroblasts cells were harvested and kept at −80 °C until RNA isolation. Isolated RNA samples from heart, liver and skeletal muscle were purchased from Ambion (Austin, US) and kept at −80°C until used for reverse transcription. Total RNA was isolated using the RNeasy kit from Qiagen (Hilden, Germany) followed by cDNA synthesis using the Omniscript RT kit from the same supplier and random hexamers. PCR (92°C for 1 minute, 55-63°C (depending on assay) for 1 minute, 72°C for 1 minute for 30 to 40 cycles (depending on assay)) was performed using the HotStartTaq DNA polymerase kit (Qiagen) with 3 μl of the prepared cDNA and gene-specific primers. All kits were used according to the manufacturer’s recommendations. PCR products were analysed by electrophoresis on 2.5 % agarose gels. Universal RNA was obtained from Biocat (Heidelberg, Germany) and total RNA isolated from brain and sperm from Stratagene (La Jolla, California, US).
Analysis and Statistical methods
Methylation profiles were calculated as described previously6 and are available from the HEP database/browser at www.epigenome.org. Kruskall-Wallis tests were used to determine differential methylation between tissues (T-DMRs), measuring the proportion of uncorrected p-values that were smaller 0.001 for all CpGs. As this test is insensitive to samples that were only measured in a single sample such as sperm and placenta, the obtained number of T-DMRs is unlikely to be overstated due to putative aberrant methylation within these samples. Some T-DMRs were experimentally validated by sequencing independent DNA samples. Equality between two groups (age and sex) was performed using Wilcoxon tests.
For the analysis of co-methylation, median methylation values were used over all technical replicates to minimize any skewing effect because of possible outliers. In addition, we excluded all CpGs where the methylation values derived from the forward and reverse reads of the same amplicon differed by more than 10%. Based on this criterion, 38% of CpGs were excluded from the analysis. As only one DNA strand was analysed following bisulfite conversion, no assessment of hemimethylation was possible in this case. Methylation changes were calculated based on the absolute methylation differences between CpG pairs of identical samples. To minimize a bias introduced by the amplicon selection, the analysis was performed using both, individual CpGs (window size 20,000bp) and CpGs of the same amplicons. Co-methylation of CpGs was described as a function of similar methylation levels over distance (in bp).
For scatter plots, equal amounts of measurements were binned and ranked by numerical order of the X-axis values, representing means of X- and Y- data. For box plots and histograms, data were binned according to the intervals indicated on the X-axis containing different numbers of measurements.
Supplementary Material
Acknowledgement
We thank Enzo Calautti for his advice on culturing of keratinocytes, Andreas Meyerhans for critical reading of the manuscript, Jennifer Maass for her help obtaining tissue samples and Kai Fischer for his support providing genomic annotations. FE thanks Young-Shin Kim for many helpful discussions. VKR was supported by a C.J. Martin Fellowship from the National Health and Medical Research Council of Australia. JA, JB, TC, RD, TAD, RH, KH, DKJ, JL, DN, RP, TW, JR and SB were supported by the Wellcome Trust.
Abbreviations
- 5′-UTR
5′ untranslated region
- ECR
evolutionary conserved region
- CDS
coding sequence
- CGI
CpG island
- HEP
human epigenome project
- T-DMR
tissue specific differentially methylated region
- ORF
open reading frame
- TSS
transcription start site
Footnotes
Competing interest declarations SB is a member of the scientific advisory board of Epigenomics AG. KB and AO are founders of Epigenomics AG, AO is a consultant of this company and KB, MB, RC, FE, CH, CK, JK, JL, TO and CT are employees of Epigenomics AG.
Citations
- 1.International Human Genome Sequencing Consortium Finishing the euchromatic sequence of the human genome. Nature. 2004;431:931–45. doi: 10.1038/nature03001. [DOI] [PubMed] [Google Scholar]
- 2.International Human Genome Sequencing Consortium Initial sequencing and analysis of the human genome. Nature. 2001;409:860–921. doi: 10.1038/35057062. [DOI] [PubMed] [Google Scholar]
- 3.Jaenisch R, Bird A. Epigenetic regulation of gene expression: how the genome integrates intrinsic and environmental signals. Nat. Genet. 2003;33:245–254. doi: 10.1038/ng1089. [DOI] [PubMed] [Google Scholar]
- 4.Murrell A, Rakyan VK, Beck S. From genome to epigenome. Hum. Mol. Genet. 2005;14:R3–R10. doi: 10.1093/hmg/ddi110. [DOI] [PubMed] [Google Scholar]
- 5.Jones PA, Martienssen RA. blueprint for a Human Epigenome Project: the AACR Human Epigenome Workshop. Cancer Res. 2005;65:11241–11246. doi: 10.1158/0008-5472.CAN-05-3865. [DOI] [PubMed] [Google Scholar]
- 6.Rakyan VK, Hildmann T, Novik KL, Lewin J, Tost J, Cox AV, Andrews TD, Howe KL, Otto T, Olek A, Fischer J, Gut IG, Berlin K, Beck S. DNA methylation profiling of the human major histocompatibility complex: a pilot study for the human epigenome project. PLoS Biol. 2004;2:2170–2182. doi: 10.1371/journal.pbio.0020405. [DOI] [PMC free article] [PubMed] [Google Scholar]
- 7.Weber M, Davies JJ, Wittig D, Oakeley EJ, Haase M, Lam WL, Schubeler D. Chromosome-wide and promoter-specific analyses identify sites of differential DNA methylation in normal and transformed human cells. Nat. Genet. 2005;37:853–862. doi: 10.1038/ng1598. [DOI] [PubMed] [Google Scholar]
- 8.Schumacher A, Kapranov P, Kaminsky Z, Flanagan J, Assadzadeh A, Yau P, Virtanen C, Winegarden N, Cheng J, Gingeras T, Petronis A. Microarray-based DNA methylation profiling: technology and applications. Nucleic. Acid. Res. 2006;34:528–542. doi: 10.1093/nar/gkj461. [DOI] [PMC free article] [PubMed] [Google Scholar]
- 9.Khulan B, Thompson RF, Ye K, Fazzari MJ, Suzuki M, Stasiek E, Figueroa ME, Glass JL, Chen Q, Montagna C, Hatchwell E, Selzer RR, Richmond TA, Green RD, Melnick A, Greally JM. Comparative isoschizomer profiling of cytosine methylation: The HELP assay. Genome Res. 2006;16:1046–1055. doi: 10.1101/gr.5273806. [DOI] [PMC free article] [PubMed] [Google Scholar]
- 10.Frommer M, McDonald LE, Millar DS, Collis CM, Watt F, Grigg GW, Molloy PL, Paul CL. A genomic sequencing protocol that yields a positive display of 5-methylcytosine residues in individual DNA strands. Proc. Natl. Acad. Sci. U S A. 1992;89:1827–1831. doi: 10.1073/pnas.89.5.1827. [DOI] [PMC free article] [PubMed] [Google Scholar]
- 11.Strichman-Almashanu LZ, Lee RS, Onyango PO, Perlman E, Flam F, Frieman MB, Feinberg AP. A genome-wide screen for normally methylated human CpG islands that can identify novel imprinted genes. Genome Res. 2002;12:543–554. doi: 10.1101/gr.224102. [DOI] [PMC free article] [PubMed] [Google Scholar]
- 12.Smiraglia DJ, Rush LJ, Fruhwald MC, Dai Z, Held WA, Costello JF, Lang JC, Eng C, Li B, Wright FA, Caligiuri MA, Plass C. Excessive CpG island hypermethylation in cancer cell lines versus primary human malignancies. Hum. Mol. Genet. 2001;10:1413–1419. doi: 10.1093/hmg/10.13.1413. [DOI] [PubMed] [Google Scholar]
- 13.Grunau C, Hindermann W, Rosenthal A. Large-scale methylation analysis of human genomic DNA reveals tissue-specific differences between the methylation profiles of genes and pseudogenes. Hum. Mol. Genet. 2000;9:2651–2663. doi: 10.1093/hmg/9.18.2651. [DOI] [PubMed] [Google Scholar]
- 14.Duncan BK, Miller JH. Mutagenic deamination of cytosine residues in DNA. Nature. 1980;287:560–561. doi: 10.1038/287560a0. [DOI] [PubMed] [Google Scholar]
- 15.Hayward BE, Kamiya M, Strain L, Moran V, Campbell R, Hayashizaki Y, Bonthron DT. The human GNAS1 gene is imprinted and encodes distinct paternally and biallelically expressed G proteins. Proc. Natl. Acad. Sci. U S A. 1998;95:10038–10043. doi: 10.1073/pnas.95.17.10038. [DOI] [PMC free article] [PubMed] [Google Scholar]
- 16.Kalscheuer VM, Mariman EC, Schepens MT, Rehder H, Ropers HH. The insulin-like growth factor type-2 receptor gene is imprinted in the mouse but not in humans. Nat. Genet. 1993;5:74–78. doi: 10.1038/ng0993-74. [DOI] [PubMed] [Google Scholar]
- 17.Verhaagh S, Schweifer N, Barlow DP, Zwart R. Cloning of the mouse and human solute carrier 22a3 (Slc22a3/SLC22A3) identifies a conserved cluster of three organic cation transporters on mouse chromosome 17 and human 6q26-q27. Genomics. 1999;55:209–218. doi: 10.1006/geno.1998.5639. [DOI] [PubMed] [Google Scholar]
- 18.Xu GL, Bestor TH, Bourc’his D, Hsieh CL, Tommerup N, Bugge M, Hulten M, Qu X, Russo JJ, Viegas-Pequignot E. Chromosome instability and immunodeficiency syndrome caused by mutations in a DNA methyltransferase gene. Nature. 1999;402:187–191. doi: 10.1038/46052. [DOI] [PubMed] [Google Scholar]
- 19.Frigola J, Song J, Stirzaker C, Hinshelwood RA, Peinado MA, Clark SJ. Epigenetic remodeling in colorectal cancer results in coordinate gene suppression across an entire chromosome band. Nat. Genet. 2006;38:540–549. doi: 10.1038/ng1781. [DOI] [PubMed] [Google Scholar]
- 20.Zeng W, Kajigaya S, Chen G, Risitano AM, Nunez O, Young NS. Transcript profile of CD4+ and CD8+ T cells from the bone marrow of acquired aplastic anemia patients. Exp. Hematol. 2004;32:806–814. doi: 10.1016/j.exphem.2004.06.004. [DOI] [PubMed] [Google Scholar]
- 21.Ashurst JL, Chen CK, Gilbert JGR, Jekosch K, Keenan S, Meidl P, Searle SM, Stalker J, Storey R, Trevanion S, Wilming L, Hubbard T. The Vertebrate Genome Annotation (Vega) database. Nucleic Acids Res. 2005;33:D459–D465. doi: 10.1093/nar/gki135. [DOI] [PMC free article] [PubMed] [Google Scholar]
- 22.Down TA, Hubbard TJP. Computational detection and location of transcription start sites in mammalian genomic DNA. Genome Res. 2002;12:458–461. doi: 10.1101/gr.216102. [DOI] [PMC free article] [PubMed] [Google Scholar]
- 23.Fuks F. DNA methylation and histone modifications: teaming up to silence genes. Curr. Opin. Genet. Dev. 2005;15:490–495. doi: 10.1016/j.gde.2005.08.002. [DOI] [PubMed] [Google Scholar]
- 24.Cawley S, Bekiranov S, Ng HH, Kapranov P, Sekinger EA, Kampa D, Piccolboni A, Sementchenko V, Cheng J, Williams AJ, Wheeler R, Wong B, Drenkow J, Yamanaka M, Patel S, Brubaker S, Tammanam H, Heltm G, Struhl K, Gingeras TR. Unbiased mapping of transcription factor binding sites along human chromosomes 21 and 22 points to widespread regulation of noncoding RNAs. Cell. 2004;116:499–509. doi: 10.1016/s0092-8674(04)00127-8. [DOI] [PubMed] [Google Scholar]
- 25.Mancini DN, Singh SM, Archer TK, Rodenhiser DI. Site-specific DNA methylation in the neurofibromatosis (NF1) promoter interferes with binding of CREB and SP1 transcription factors. Oncogene. 1999;18:4108–4119. doi: 10.1038/sj.onc.1202764. [DOI] [PubMed] [Google Scholar]
- 26.Clark SJ, Harrison J, Molloy PL. Sp1 binding is inhibited by (m)Cp(m)CpG methylation. Gene. 1997;195:67–71. doi: 10.1016/s0378-1119(97)00164-9. [DOI] [PubMed] [Google Scholar]
- 27.Holler M, Westin G, Jiricny J, Schaffner W. Sp1 transcription factor binds DNA and activates transcription even when the binding site is CpG methylated. Genes Dev. 1988;2:1127–1135. doi: 10.1101/gad.2.9.1127. [DOI] [PubMed] [Google Scholar]
- 28.Harrington MA, Jones PA, Imagawa M, Karin M. Cytosine methylation does not affect binding of transcription factor Sp1. Proc. Natl. Acad. Sci. U S A. 1988;85:2066–2070. doi: 10.1073/pnas.85.7.2066. [DOI] [PMC free article] [PubMed] [Google Scholar]
- 29.Fraga MF, Ballestar E, Paz MF, Ropero S, Setien F, Ballestar ML, Heine-Suner D, Cigudosa JC, Urioste M, Benitez J, Boix-Chornet M, Sanchez-Aguilera A, Ling C, Carlsson E, Poulsen P, Vaag A, Stephan Z, Spector TD, Wu YZ, Plass C, Esteller M. Epigenetic differences arise during the lifetime of monozygotic twins. Proc. Natl. Acad. Sci. U S A. 2005;102:10604–10609. doi: 10.1073/pnas.0500398102. [DOI] [PMC free article] [PubMed] [Google Scholar]
- 30.Shiota K. DNA methylation profiles of CpG islands for cellular differentiation and development in mammals. Cytogenet. Genome Res. 2004;105:325–334. doi: 10.1159/000078205. [DOI] [PubMed] [Google Scholar]
- 31.Costello JF, Smiraglia DJ, Plass C. Restriction landmark genome scanning. Methods. 2002;27:144–149. doi: 10.1016/s1046-2023(02)00067-1. [DOI] [PubMed] [Google Scholar]
- 32.Shiota K, Kogo Y, Ohgane J, Imamura T, Urano A, Nishino K, Tanaka S, Hattori N. Epigenetic marks by DNA methylation specific to stem, germ and somatic cells in mice. Genes Cells. 2002;7:961–969. doi: 10.1046/j.1365-2443.2002.00574.x. [DOI] [PubMed] [Google Scholar]
- 33.Ansel KM, Djuretic I, Tanasa B, Rao A. Regulation of Th2 Differentiation and Il4 Locus Accessibility. Annu. Rev. Immunol. 2006;24:607–656. doi: 10.1146/annurev.immunol.23.021704.115821. [DOI] [PubMed] [Google Scholar]
- 34.Jones PA, Baylin SB. The fundamental role of epigenetic events in cancer. Nat Rev Genet. 2002;3:415–428. doi: 10.1038/nrg816. [DOI] [PubMed] [Google Scholar]
- 35.Song F, Smith JF, Kimura MT, Morrow AD, Matsuyama T, Nagase H, Held WA. Association of tissue-specific differentially methylated regions (TDMs) with differential gene expression. Proc. Natl. Acad. Sci. U S A. 2005;102:3336–3341. doi: 10.1073/pnas.0408436102. [DOI] [PMC free article] [PubMed] [Google Scholar]
- 36.Futscher BW, Oshiro MM, Wozniak RJ, Holtan N, Hanigan CL, Duan H, Domann FE. Role for DNA methylation in the control of cell type specific maspin expression. Nat. Genet. 2002;31:175–179. doi: 10.1038/ng886. [DOI] [PubMed] [Google Scholar]
- 37.Bernstein BE, Kamal M, Lindblad-Toh K, Bekiranov S, Bailey DK, Huebert DJ, McMahon S, Karlsson EK, Kulbokas EJ, 3rd, Gingeras TR, Schreiber SL, Lander ES. Genomic maps and comparative analysis of histone modifications in human and mouse. Cell. 2005;120:169–181. doi: 10.1016/j.cell.2005.01.001. [DOI] [PubMed] [Google Scholar]
- 38.ENCODE Project Consortium The ENCODE (ENCyclopedia Of DNA Elements) Project. Science. 2004;306:636–640. doi: 10.1126/science.1105136. [DOI] [PubMed] [Google Scholar]
- 39.Altshuler D, Brooks LD, Chakravarti A, Collins FS, Daly MJ, Donnelly P. International HapMap Consortium. Nature. 2005;437:1299–1320. [Google Scholar]
- 40.Yoo CB, Jones PA. Epigenetic therapy of cancer: past, present and future. Nat. Rev. Drug Discov. 2006;5:37–50. doi: 10.1038/nrd1930. [DOI] [PubMed] [Google Scholar]
- 41.Widschwendter M, Siegmund KD, Muller HM, Fiegl H, Marth C, Muller-Holzner E, Jones PA, Laird PW. Association of breast cancer DNA methylation profiles with hormone receptor status and response to tamoxifen. Cancer Res. 2004;64:3807–3813. doi: 10.1158/0008-5472.CAN-03-3852. [DOI] [PubMed] [Google Scholar]
- 42.Bjornsson HT, Fallin MD, Feinberg AP. Trends Genet. 2004;20:350–358. doi: 10.1016/j.tig.2004.06.009. [DOI] [PubMed] [Google Scholar]
- 43.Curwen V, Eyras E, Andrews TD, Clarke L, Mongin E, Searle SM, Clamp M. The Ensembl automatic gene annotation system. Genome Res. 2004;14:942–950. doi: 10.1101/gr.1858004. [DOI] [PMC free article] [PubMed] [Google Scholar]
- 44.Gardiner-Garden M, Frommer M. CpG islands in vertebrate genomes. J. Mol. Biol. 1987;196:261–282. doi: 10.1016/0022-2836(87)90689-9. [DOI] [PubMed] [Google Scholar]
- 45.Takai D, Jones PA. Comprehensive analysis of CpG islands in human chromosomes 21 and 22. Proc. Natl. Acad. Sci. U S A. 2002;99:3740–3745. doi: 10.1073/pnas.052410099. [DOI] [PMC free article] [PubMed] [Google Scholar]
- 46.Berlin K, Ballhause M, Cardon K. Improved bisulfite conversion of DNA. PCT/WO/2005/038051 Patent. 2005
- 47.Lewin J, Schmitt AO, Adorjan P, Hildmann T, Piepenbrock C. Quantitative DNA methylation analysis based on four-dye trace data from direct sequencing of PCR amplificates. Bioinformatics. 2004;20:3005–3012. doi: 10.1093/bioinformatics/bth346. [DOI] [PubMed] [Google Scholar]
Associated Data
This section collects any data citations, data availability statements, or supplementary materials included in this article.


