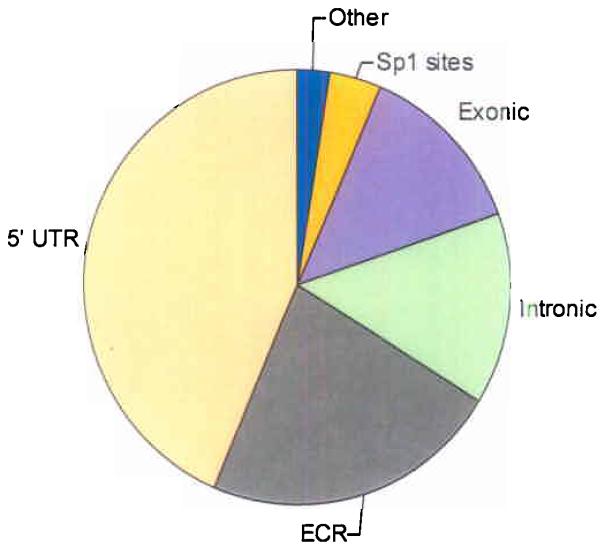
Figure 1. Type and distribution of amplicons.

In total, 2,524 amplicons were analyzed from 6 distinct categories: 43.7% for 5′-untranslated regions (5′-UTR), 22.5% for evolutionary conserved regions (ECR), 14.3% for intronic regions (Intronic), 13.3% for exonic regions (Exonic), 3.6% for Sp1 transcription factor binding sites (Sp1) and 2.6% for Other. Details of the selection criteria for each category are described in Materials and Methods.
