Figure 6.
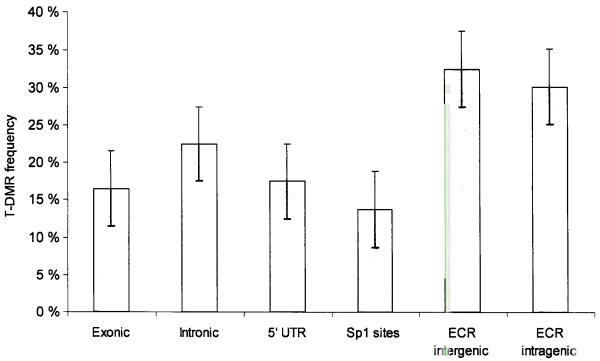
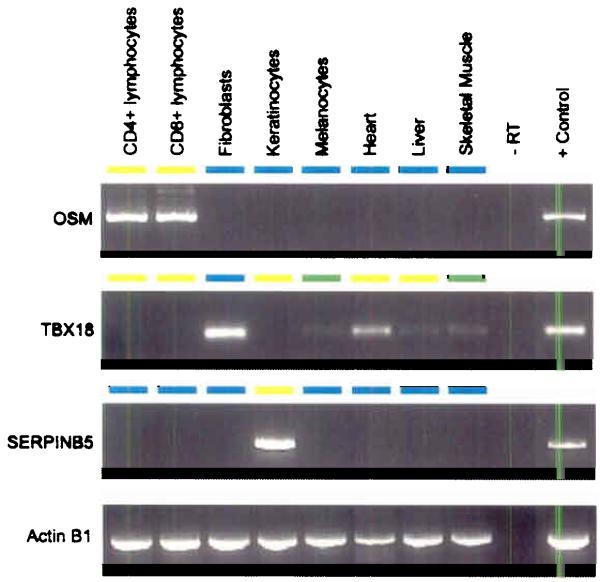
(a) Relative proportion of putative T-DMRs. Normalized for the number of amplicons in each category, the proportion of T-DMRs was highest in ECRs, both intergenic and intragenic ECRs while T-DMRs located within 5′-UTRs have a lower frequency of occurrence (b) Correlation between 5′-UTR methylation and mRNA expression. Representative results are shown for 2 genes. Expression was determined for 43 genes and one positive control (ACTINB1) in 8 tissues/cell types using reverse transcriptase (RT) PCR. Total RNAs derived from mixed tissues and cell lines were used as positive control. Differential 5′-UTR methylation is inversely correlated with mRNA expression for OSM and SERPINB5 (for which the inverse correlation was previously known) but not for TBX18. The colour code depicts the degree of 5′-UTR methylation for each gene (yellow ≈ 0% methylation, green ≈ 50% and blue ≈ 100% methylation).


