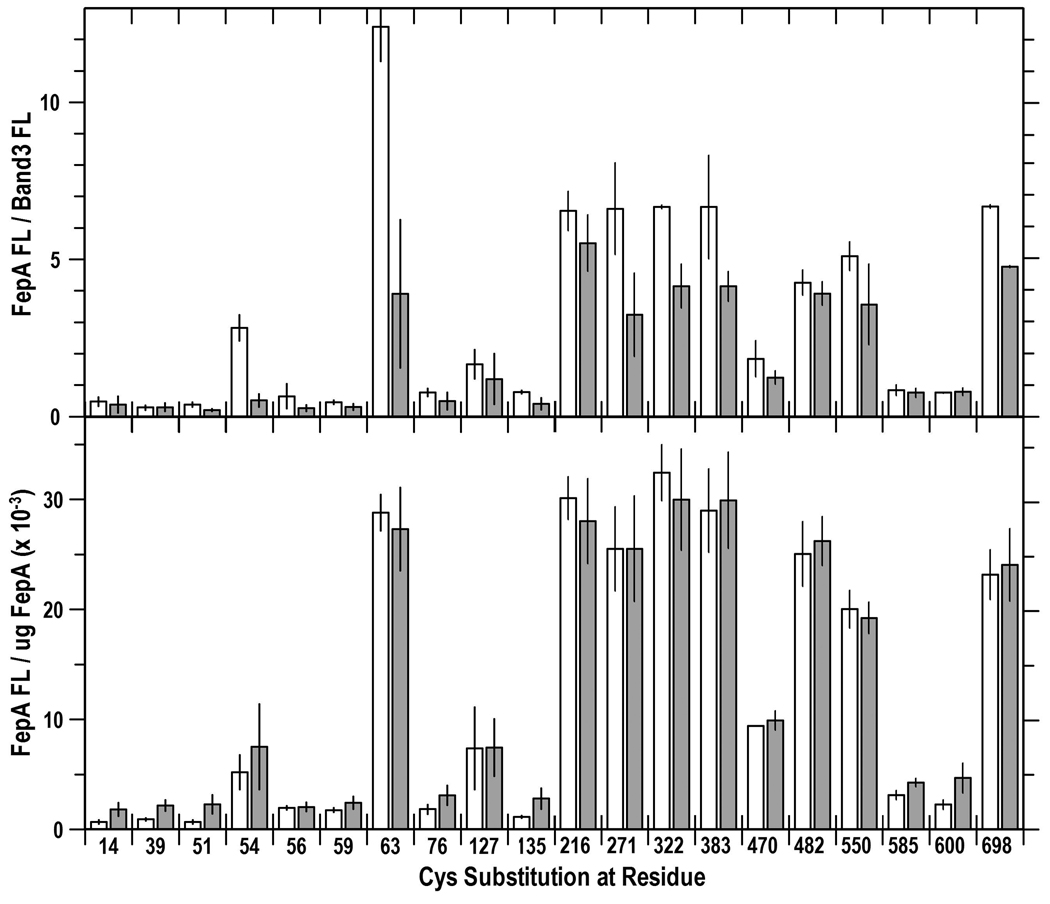
Figure 3. Evaluation of TonB-dependent conformational changes in FepA: Comparison of Cys fluoresceination in tonB+ and tonB cells.
Sites in FepA that were significantly labeled by FM were re-analyzed and compared in tonB+ (white bars) and tonB (grey bars) cells. We incorporated the concentration of FepA (from anti-FepA immunoblots) into calculations to compare the relative and absolute FM-labeling levels. (Top) Relative levels of FM-labeling in tonB+ and tonB bacteria. Fluorescence images from SDS-PAGE gels of cell lysates were analyzed by IMAGEQUANT (Molecular Dynamics). Bars depict the mean FM-labeling of FepA proteins relative to band 3 in OKN3 (white) and OKN13 (grey; mean of 3 experiments, with associated standard error). FepA proteins were less fluoresceinated in the tonB strain, because they were expressed at lower levels (Fig. S4). (Bottom) Absolute levels of FM-labeling in tonB+ and tonB strains. The extent of residue labeling was corrected for the expression level of each of the mutant FepA protein, to yield the absolute labeling level (fluorescence intensity/ug FepA). The correction eliminated the differences in labeling between tonB+ and tonB cells seen in the top panel.

