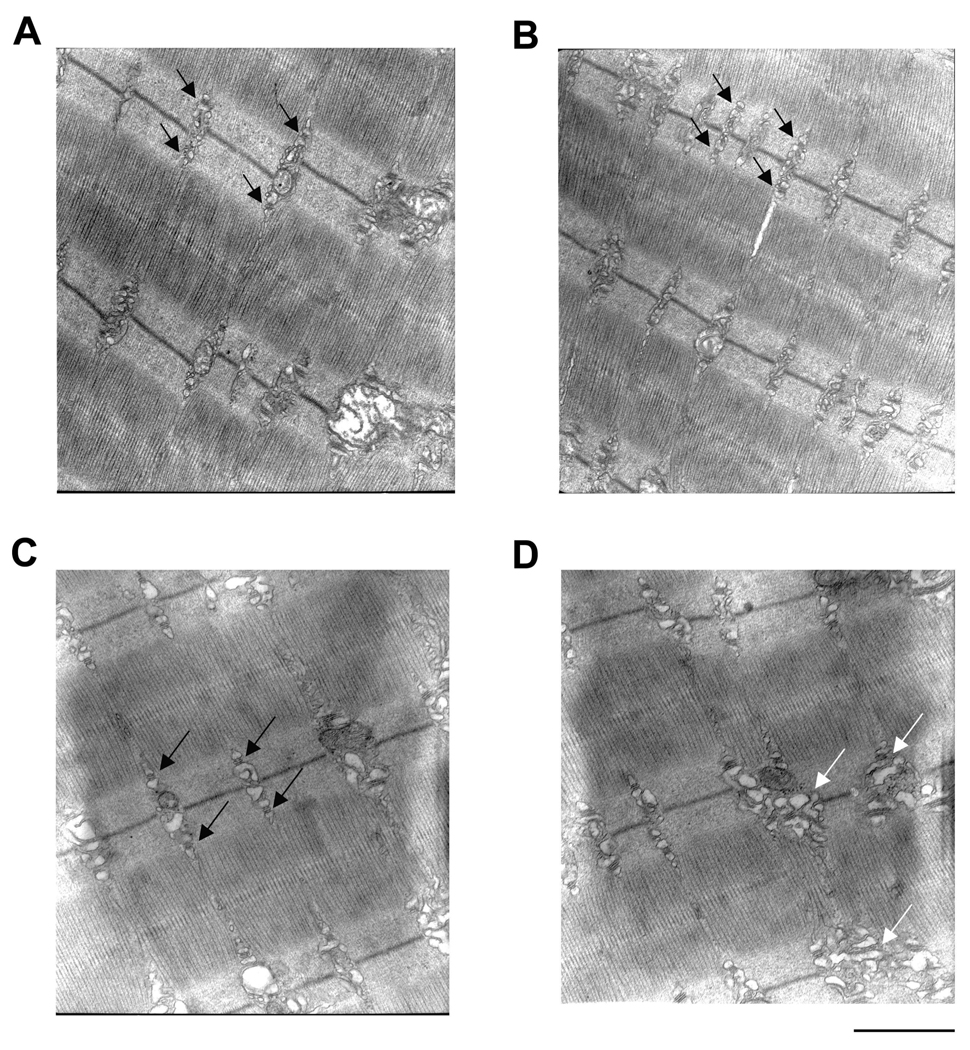
Figure 4. Electron microscopy examination of triad organization.
A and B. Samples from young mice taken at 25,000× magnification. Black arrows indicate well-organized triads. C and D. Samples from old mice taken at 25,000× magnification. Black arrows indicated well-organized triads in C. White arrows indicate disorganized triad structures in D. Images are representative of 10 fibers from 5 mice. Calibration bar = 1µm.

