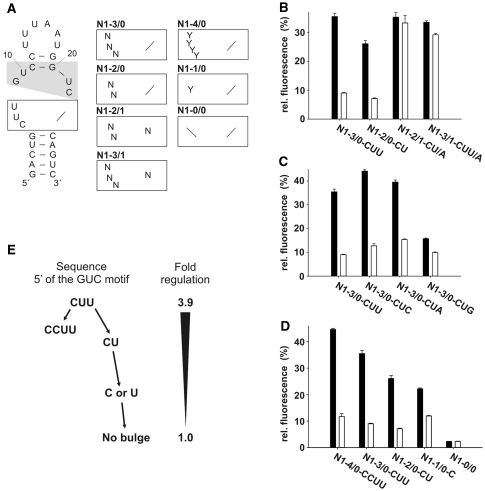
Figure 2.
Saturating mutagenesis of the internal loop. (A) Secondary structure of N1. The GUC motif is shaded in gray. The lower part of the internal loop (boxed) was analyzed and randomized. Nucleotides are indicated with N (any nucleotide) or Y (pyrimidines). (B–D) gfp expression in the absence (black bars) and presence (white bars) of 100 µM neomycin. The fluorescence emission of the vector pWHE601 (6) expressing gfp without an aptamer in its 5′UTR was set as 100%. Background level of a vector with no gfp expression was subtracted from all data. Values represent the mean of three independently grown cultures. Measurements were repeated at least twice. (E) Schematic representation of the connection between loop size and regulation.

