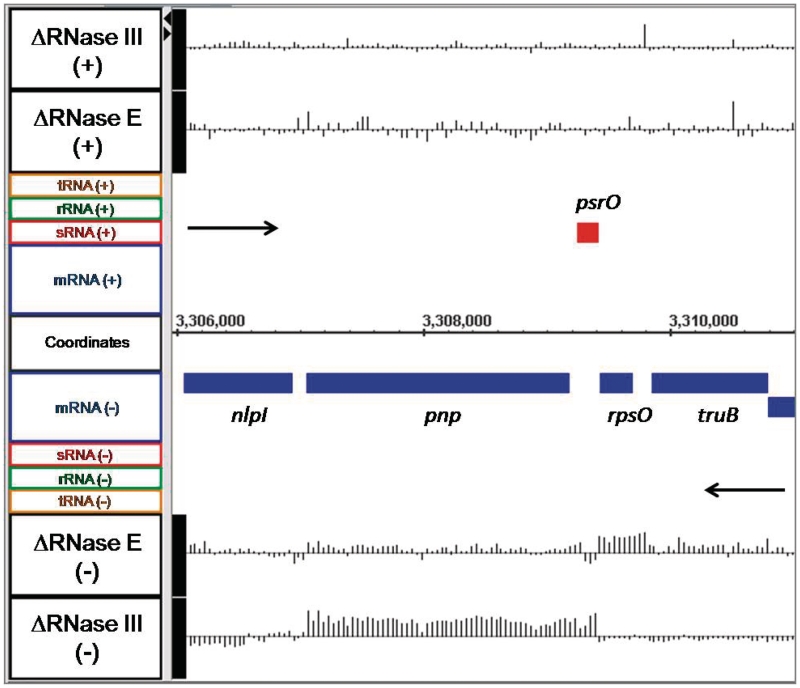
Figure 1.
Microarray data for the rpsO pnp operon. Changes in the steady-state levels of the rpsO and pnp mRNAs in RNase E and RNase III deletion mutants. The image presented was obtained from a screen shot of the Integrated Genome Browser program (51). Labels for the data displayed are located on the far left of the image and identify all features within the same horizontal plane. Gene names appear above or below the horizontal bar indicating their location on the genome relative to actual nucleotide coordinates, which are displayed at the center of the graph. Objects above the genome coordinate line are on the forward strand, while objects below the coordinate line are on the reverse strand. Black arrows indicate the direction of transcription. CDSs are colored blue, while red indicates a sRNA. The actual array data are displayed as a series of vertical lines representing the log2 ratio of fluorescence between the mutant and wild-type strains along a horizontal that intersects the label on the far left designating the mutant strains and strand (+ or −). The horizontal line in the array data is equal to a log2 ratio of 0, with vertical lines going above or below the baseline, representing changes in the log2 ratio of greater or less than 0 for each probe. Vertical lines above the baseline indicate higher RNA abundance in the mutant versus wild type, while line extending below the baseline indicate lower RNA abundance in the mutant versus wild type. Maximum and minimum peak heights displayed are equivalent to log2 ratios of ±3.

