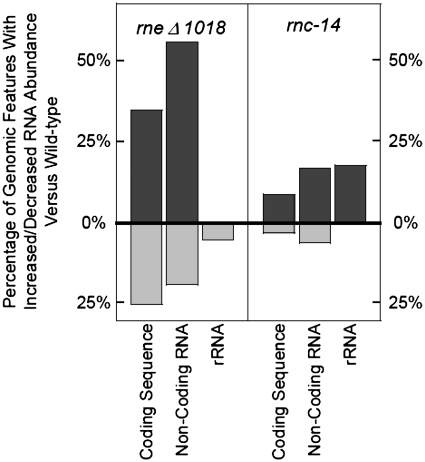
Figure 7.
Characterization of transcriptome changes in the absence of RNase E and RNase III. The data within the graph is derived from the number of specific genomic features in each strain that contain a region of at least 100 nt changed by at least 1.5-fold, versus the total number of that gene feature annotated in the genome (see ‘Materials and Methods’ section). Dark grey bars that extend above the 0% X-axis indicate the number of a specific type of genomic feature which contain an area of increased abundance, versus the number of total features of that type. Light grey bars that extend below the 0% X-axis indicate the number of a specific type of genomic feature that contain an area of decreased abundance, versus the number of total features of that type. The list of genomic features affected in these strains can be found in Supplementary Table S1. The two annotated tmRNA features are not included in this figure.

