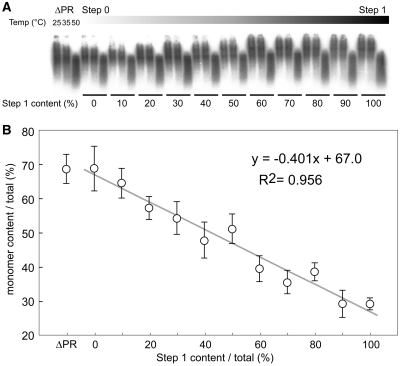
Figure 5.
Stoichiometric analysis of Gag processing and RNA dimerization. ΔPR mutant plasmid and the mixtures of Step0 and 1 plasmids were applied for transfection, and a series of resultant viral particles were harvested. The ratios of Step 1 to Step 0 was changed successively from 10:0 to 0:10. (A) Virion RNA profiles were detected by northern blotting in a native agarose gel as in Figure 2. (B) The monomer content of each RNA in native condition was calculated and represented by a scatter diagram. The data are the average of three independent experiments and the error bars represent SEM. The formula and R-squared value of the straight-line approximation are shown.

