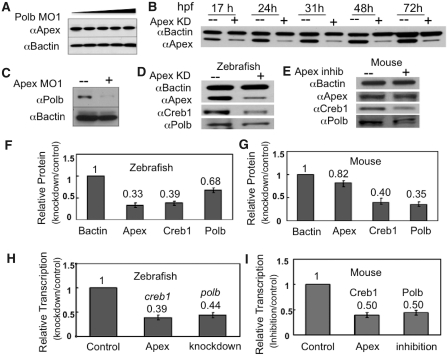
Figure 3.
While knockdown of Polb does not affect Apex levels, knockdown of Apex has a profound effect on Polb and Creb1 in both zebrafish embryos and primary cultures of murine B cells. (A) Knockdown of Polb does not alter Apex protein levels. Extracts were prepared from 1 dpf embryos in which Polb had been knocked down by microinjection of increasing amounts of MO1 and probed by western blot analysis using rabbit polyclonal anti-Apex or anti-B actin (9). Embryos were microinjected with Polb MO1 or water; extracts were prepared at 1 dpf. (B) Knockdown of Apex by MO results in Apex loss for the duration of these experiments. Western blot analysis of protein extracts prepared on the indicated days was performed using anti-Apex and anti-B-actin. Loss of Apex, shown here for 3 days after knockdown, was usually detected for up to 5 dpf. (C) Knockdown of Apex results in failure of Polb protein to appear at the appropriate time in zebrafish embryos. Protein extracts were prepared from 3 dpf embryos. Apex hypomorphic embryos (+) were created by microinjecting 0.15 mM Apex MO at the 1–2 cell stage. (D and E) Western blotting analysis of Creb1 and Polb protein levels in Apex knockdown embryos at 24 hpf or Apex-inhibited mouse primary B lymphocytes. Note that in the latter, Apex activity is inhibited by CRT0044876 but that Apex protein is only slightly diminished. (F and G) Quantitation of western blot results in Apex knockdown embryos and Apex-inhibited mouse primary B lymphocytes. Data for (F) are the average of four independent experiments ± SD of the mean. Values for (G) are the average of three independent experiments ± SD of the mean. (H and I) Quantitative RT–PCR analysis of creb1 and polb mRNA levels in Apex knockdown zebrafish embryos and Apex-inhibited mouse lymphocytes. Loss of Apex in either mouse cells or zebrafish embryos results in diminution of both creb1 and polb mRNA. The values for H are the average of five independent experiments ± SD of the mean, while the values for I are the average of three independent experiments ± SD of the mean.

