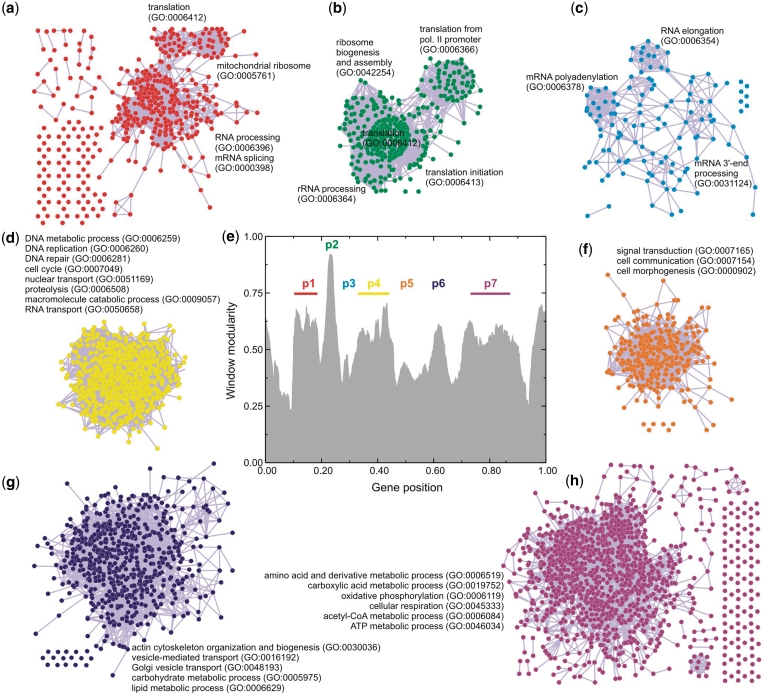
Figure 4.
Graph representation of the CFM ordering. The axes relative to gene position have been divided by the total number of genes: 4655. (e) CFM ordering was sliced in seven pieces, using the window modularity peaks as a guide for this division. The genes of each piece, together with the information on the interaction between these genes, were fed to Medusa application to produce the network graphs. (a–c,e–h) Network graphs associated with each peak, whose biological functions are mapped with GO terms using ‘DAVID’ bioinformatics resources.

