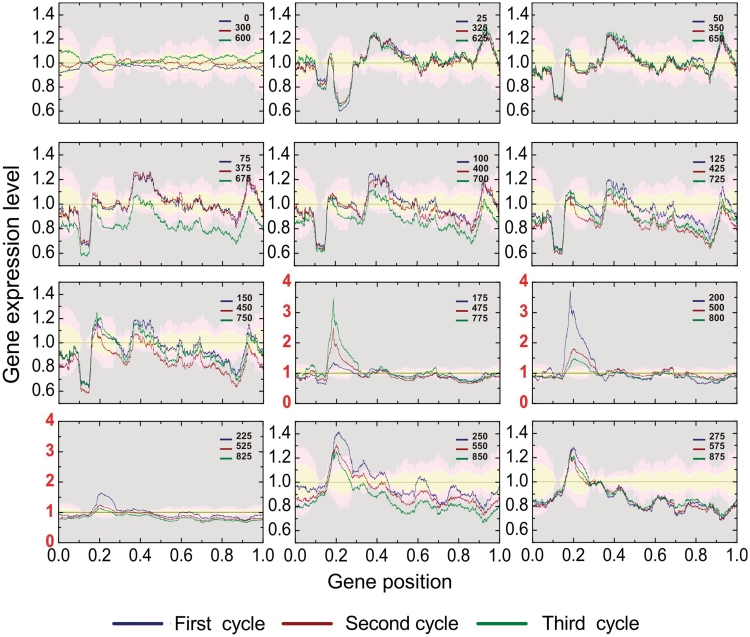
Figure 6.
The respiration cycle transcriptograms and an estimate of the confidence intervals. The reference averages and their variations are estimated from the average and standard deviation for the relative expression level of each gene i in the initial state of the three respiration cycles. The yellow bands represent values that deviates from the average from 0 to 2  ; pink bands stand for deviations from 2
  to 4
to 4  , and the gray area stands for deviations larger than 4
  . Each panel presents data relative to corresponding states of the three cycles. The ordering region in the interval 0.35–0.45 presents variations that are clearly in the gray region, mainly in times corresponding to T = 150, 450 and 4750 min, and T = 175, 475 and 775 min, which correspond to the final fermentation phase and the beginning of high consumption of O2.

