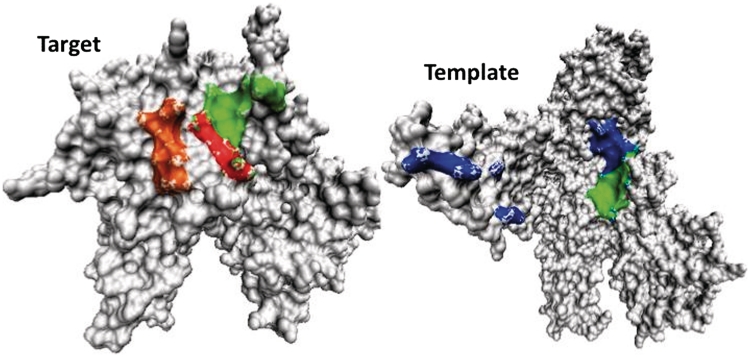
Figure 4.
The native binding regions of DNA (in orange) and RNA (in red) of the target domain 1 of Chain B (PDB ID#2nvqB1) is compared to the predicted RNA binding region (in green) as well as the corresponding RNA binding region of the template (2o5iM) (in green, all binding region in blue). The native RNA binding region of the target is completely overlapped with the predicted region (red is a part of green). For clarity, residue index of >1000 for 2o5i is not shown.

