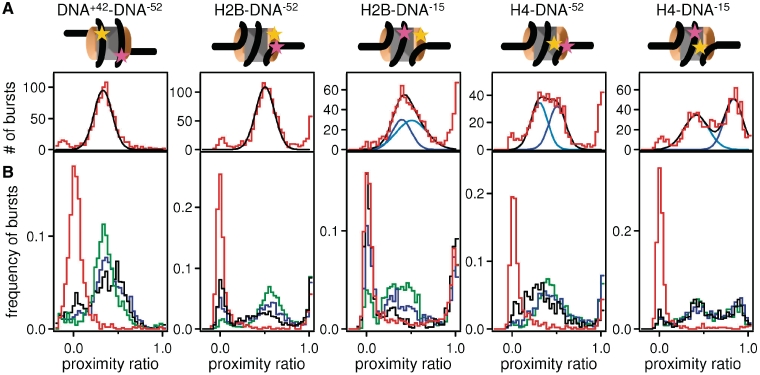
Figure 4.
spFRET can be used to measure intranucleosomal conformational changes. (A) Example of a proximity ratio distribution for DNA+42–DNA−52, H2B–DNA−52, H2B–DNA−15, H4–DNA−52 and H4–DNA−15 at 150 mM NaCl. Cartoons of nucleosomes indicate the relative locations of labels on the nucleosome. The FRET population represents intact nucleosomes. The number of NoFRET bursts is low. The fit of FRET population is shown in black, fits for subpopulations of the FRET fraction (if present) are shown in different shades of blue. In intact nucleosomes, subpopulations arise if the distances between the fluorophore on the DNA and the fluorophores on the two copies of the labeled histones differ (sSupplementary Data 1.2). (B) Examples of proximity ratio distributions for each construct (as above) at 400 mM (green), 600 mM (blue), 800 mM (black) and 1200 mM (red) NaCl. Elevated [NaCl] causes an increase of the NoFRET population at the cost of the FRET population indicating that the distance between the fluorophores increased above the distance for energy transfer. Other than H4–DNA−15, all constructs displayed changes in the proximity ratio distribution of the FRET population upon increase of [NaCl] which are related to structural changes within the nucleosome.

