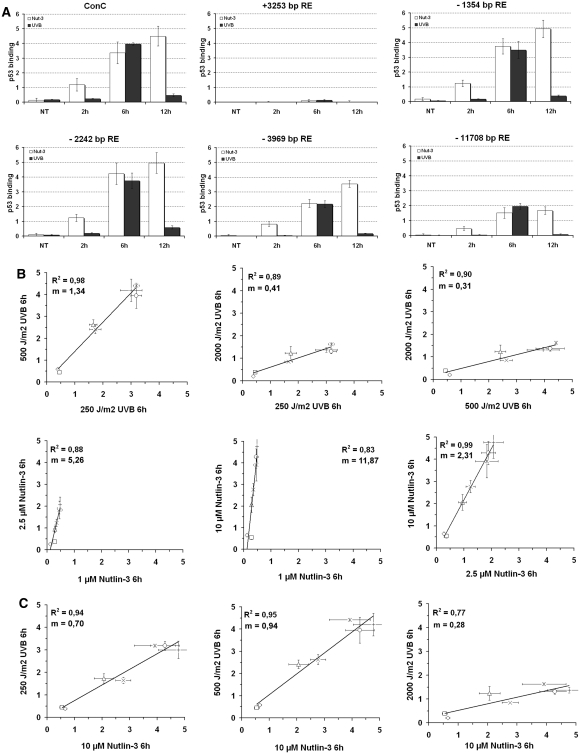
Figure 2.
UVB and Nutlin-3 treatment doses lead to similar p53 binding patterns on naked DNA. (A) In vitro measurement of p53 binding activities using MAPD. wt fibroblasts were exposed to 500 J/m2 UVB or to 10 µM Nutlin-3 then collected at 2, 6 and 12 h for nuclear extract preparation. p53 binding to the REs located on p21 and to the positive control sequence (ConC) was measured by MAPD. Binding measured on the negative control sequence (WRNC) was subtracted from values obtained for the other REs. Experiments were performed in triplicate and data are presented as mean ± SD. (B) Permutative comparisons of binding intensities measured by MAPD on the p53 REs located on p21 following UVB and Nutlin-3 treatment. Each data set obtained at 6 h for a treatment dose was compared with the other doses using scatter plot representation. (C) Permutative comparisons between p53 binding intensities obtained following 250, 500 and 2000 J/m2 UVB and 10 µM Nutlin-3. Each data set obtained at 6 h for the three UVB doses was compared with the data set obtained at 6 h with 10 µM Nutlin-3. Nomenclature: open rectangle, WRNC; Ж, ConC; open rhombus, +3253 bp RE; open circle, –1354 bp RE; plus symbol, –2242 bp RE; Times symbol, –3969 bp RE; open triangle, –11 708 bp RE.

