Figure 4.
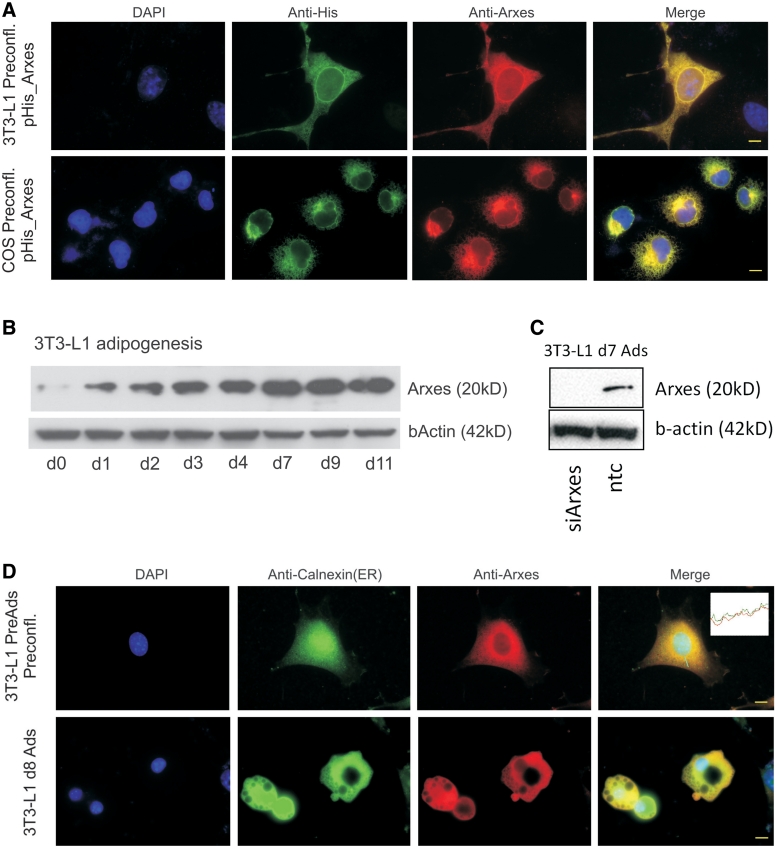
Protein evidence and localization of Arxes in the ER. (A) Shown are 3T3-L1 and COS cells overexpressing Arxes with a 6xHis-tag. Right-most panels show merge of all channels. Scale bars represent 10 µm. (B) Protein was harvested at indicated time points during 3T3-L1 differentiation and subjected to western blotting using the anti-Arxes antibody. β-Actin served as loading control. Increase in protein level is in concordance with Arxes mRNA measurements. (C) 3T3-L1 cells were transduced with silencing constructs (siArxes) or non-targeting control (ntc), and induced to undergo adipogenesis for 7 days with standard DMI treatment. Western blot analysis is performed on protein lysates to prove specificity of antibody. β-Actin served as loading control. (D) Endogenous Arxes protein location is shown in the red channel for preadipocytes and mature adipocytes (d8). The merged image shows a high degree of overlap with the ER-marker Calnexin, as also shown by the channel intensity profile in the inset. Scale bars represent 10 µm.

