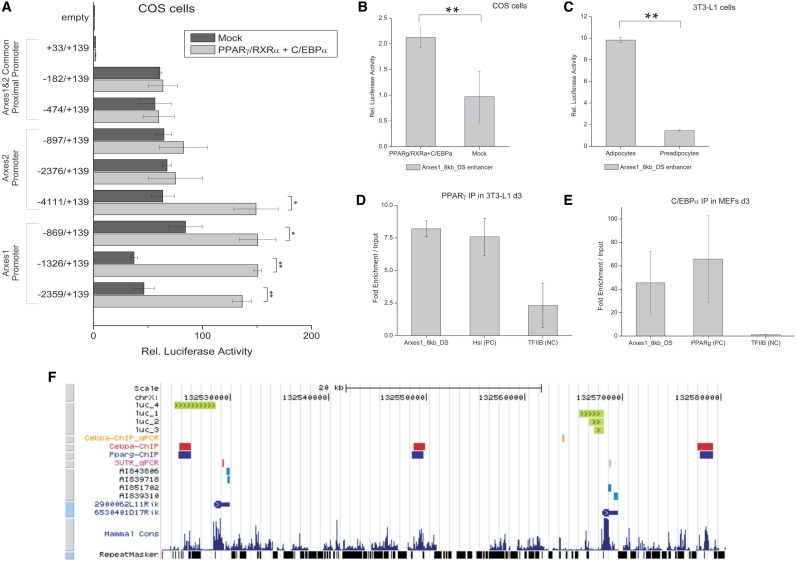
Figure 5.
Transactivation of Arxes promoters and enhancers by PPARγ and C/EBPα. (A) Indicated Arxes1 and Arxes2 promoter elements were cloned into a Luciferase reporter vector and cotransfected with either PPARγ, RXRα and C/EBPα expression vectors or empty vectors (mock) in COS cells. After 48 h, cells were lysed and assayed for luciferase activity using a luminometer. Data were normalized to Renilla luciferase readings to account for differences in transfection efficiencies. Finally, data were related to empty reporter vector activity. Data are represented as mean ± SEM from independent biological replicates (n = 2–3). Student’s t-test: *P < 0.05; **P < 0.01. (B) An enhancer region 8 kb downstream of the Arxes1 gene [Arxes1_8 kb_DS, identified by a recent genome-wide study (6)] was cloned in a luciferase reporter vector containing a minimal promoter, which was transfected and assayed as described above. Data are represented as mean ± SEM from three independent biological replicates. Student’s t-test: **P < 0.01. (C) The Arxes1_8 kb_DS enhancer region was electroporated in either preconfluent 3T3-L1 preadipocytes or mature 3T3-L1 adipocytes. Cells were lysed 48 h later and analyzed as described above. Data are represented as mean ± SEM from three different electroporation experiments. Student’s t-test: **P < 0.01. (D) ChIP was performed in d3 3T3-L1 cells using an anti-PPARγ antibody. PPARγ-bound immunoprecipitated DNA was quantified with qPCR using primers directed against the Arxes1_8 kb_DS enhancer region, Hsl promoter (published, positive control) and TFIIB promoter (as negative control). Measurements were normalized to signal of 18SrRNA and related to input DNA. Data are represented as mean ± SEM from two independent experiments. (E) ChIP-qPCR was performed in d3 MEFs with anti-C/EBPα antibody as described in Figure 1B. Primers target the Arxes1-8 kb-DS enhancer, PPARγ promoter (positive control) and the TFIIB promoter (negative control). Data are represented as mean ± SEM from two independent experiments. (F) Genomic overview of the Arxes loci in UCSC genome browser. (From top to bottom) Promoter regions showing a significant luciferase activity increase upon cotransfection with PPARγ, RXRα, and C/EBPα expression vectors (luc_1 to luc_4, compare to Figure 5A); C/EBPα ChIP-qPCR region from Figure 1B; C/EBPα and PPARγ ChIP–chip regions from Lefterova et al.; Amplicons from specific qPCR primers in 3′UTRs, used throughout this study; EST sequences represented on microarray; RefSeq database annotation (2900062L11Rik = Arxes2; 6530401D17Rik = Arxes2); Conservation and repeat masker track from UCSC genome browser.

