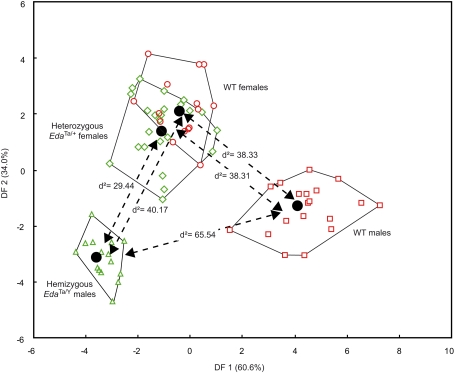
Figure 4.
Results of the discriminant analysis of the mandibular elliptical Fourier descriptors. Scatterplots of the Wild-type (males: red squares; females: red circles), hemizygous EdaTa/Y (green triangles), and heterozygous EdaTa/+ (green diamonds) specimens along the first and second canonical discriminant axes (DF1, DF2). The unbiased Mahalanobis D2 distances between the centroids of each mouse strain group are reported.

