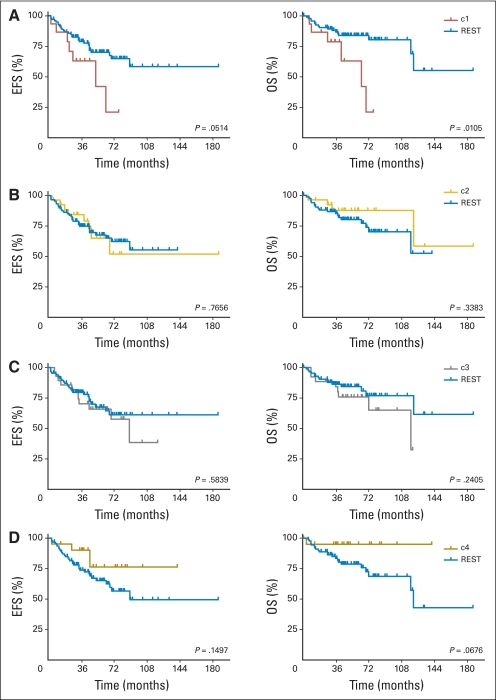
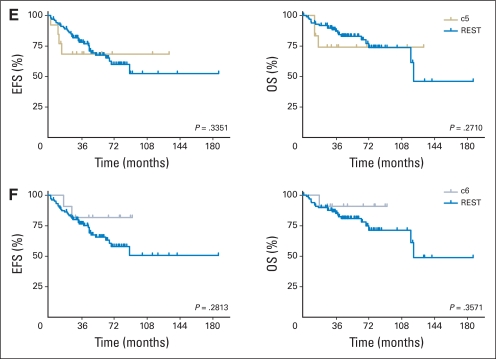
Fig A2.
(A-F) Kaplan-Meier survival analysis of patients in each non-negative matrix factorization subgroup reveals (A) decreased survival (event-free survival [EFS] and overall survival [OS]) of patients having c1 subgroup tumors relative to all other tumors (REST). (F) Increased OS is noted for c6 subgroup tumors. Survival analyses were based on clinical risk, histologic subtype, and M stage and are provided as figures in the Data Supplement.


