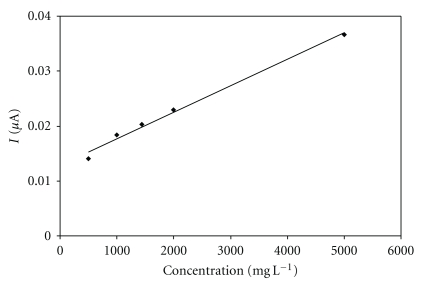
Figure 9.
Biosensor response to glucose at input potential +0.35 V. Measurement condition: batch volume 200 μL; input potential 0.35 V (versus Ag/AgCl); pH of the supporting electrolyte 7.5; flow rate 0.5 mL min−1; measured on SPCE/RhO2/GDH; analysis in a flow arrangement; regression equation: y = 5.00 × 10⁻⁶ x + 0.0129, R 2 = 0.991.

