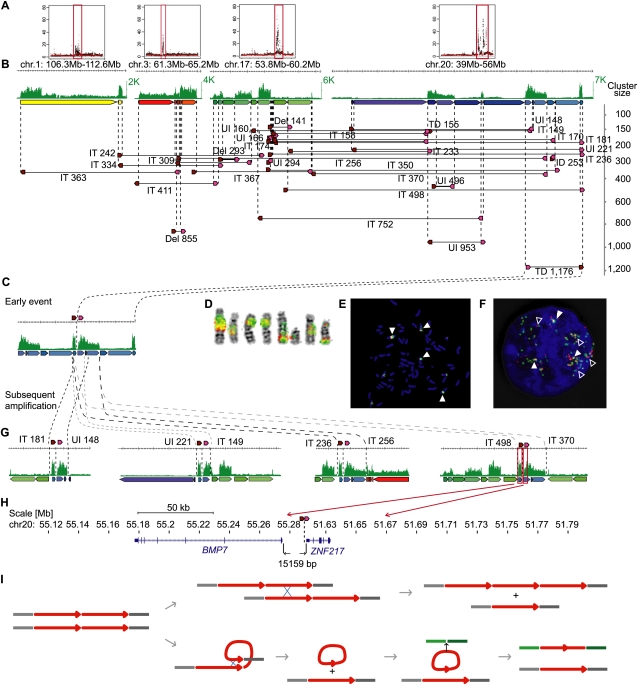
Figure 4.
Architecture and genealogy of amplifications in MCF-7. (A) Copy-number plots of chromosomes 1, 3, 17, and 20 with amplified regions (red boxes). (B) Concordant tag distributions are shown for amplified genomic regions (top, green track). Genomic segments between predicted breakpoints are indicated by colored arrows (middle) and dPET clusters with cluster sizes greater than 140 are represented by horizontal lines flanked by dark red and pink arrows indicating 5′ and 3′ anchor regions (bottom). Small to large dPET clusters are arranged from top to bottom. All but three dPET clusters were classified as complex. Mapping characteristics are described by: (Del) deletion; (IT) isolated translocation; (UI) unpaired inversion; (TD) tandem duplication. Cluster sizes are given for each cluster. (C) Possible genealogy of amplification. TD1,176 occurred early and subsequent rearrangements have pasted TD1,176 in different genomic contexts (G). (D–F) Double-color FISH using probes flanking TD1,176. Red, chr20:51,920,860–52,096,191; green, chr20:55,137,293–55,311,637. Double signals (filled arrowheads) indicate the fusion of the two loci and single signals indicate the normal genomic distance (open arrowhead). (D) Metaphase chromosomes, (E) metaphase nucleus, and (F) interphase nucleus showing amplification and fusion of breakpoint flanking sequences. (H) BMP7 (left) and ZNF217 (right) are juxtaposed by the TD1,176 rearrangement in a distance of 15,159 bp. (I) Models of local and interchromosomal amplification. Chromosomes are represented by gray and green horizontal lines. Amplified segment is represented by a red arrow. The initial tandem duplication (left) allows local amplification between two sister chromatids or homologous chromosomes (top) or interchromosomal translocation (bottom).

