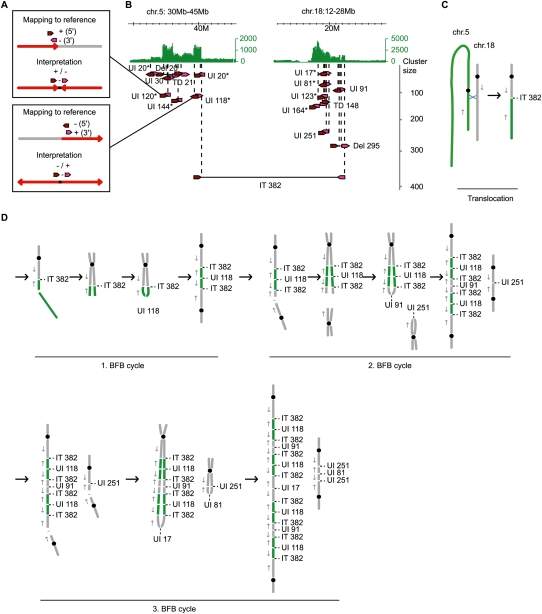
Figure 6.
Accumulation of short-span unpaired inversions in amplified regions of gastric tumor 17. (A) PET mapping pattern of short-span unpaired inversions and the interpretation. The mapping of a 5′ anchor (dark red arrow) to the + strand and a 3′ anchor (pink arrow) to the – strand indicates a head-to-head fusion (red arrows) with increasing chromosomal coordinates closer to the breakpoint (top) and a 5′ – strand/3′ + strand mapping indicates a tail-to-tail fusion with decreasing chromosomal coordinates closer to the breakpoint (bottom). UI120 and UI118 in B are examples of head-to-head and tail-to-tail fusions, respectively. (B) Amplifications on chromosomes 5 and 18 of gastric tumor 17 are indicated by concordant tag counts (green). Cancer structural rearrangements with dPET cluster sizes >15 are indicated by dark red and pink arrows for 5′ and 3′ anchors, respectively. Abbreviations and figure structure are described in the legend of Figure 4B. Unpaired inversions with a breakpoint distance <40 Kb are indicated by asterisks. (C) Schematic representation of an isolated translocation between chromosome 5 (green) and 18 (gray). Black circles represent centromeres; blue X represents site of recombination; gray arrows indicate the direction of increasing genomic coordinates. (D) Interpretation of accumulated short unpaired inversions in amplifications by BFB cycles.

