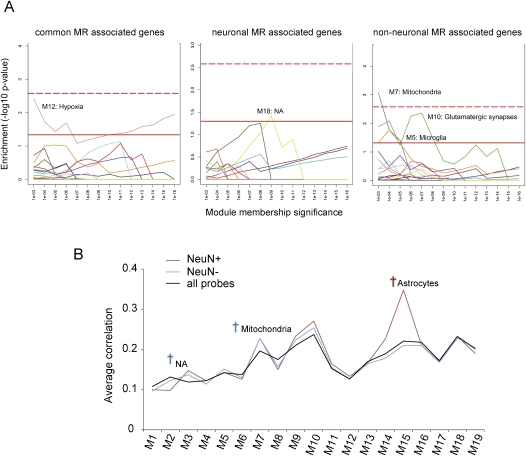
Figure 6.
Module membership analysis of the genes associated with MRs. (A) Enrichment analysis for modules of coexpressed genes. Each color indicates one of 19 coexpression modules that was previously identified in the human cortical transcriptome (Oldham et al. 2008). Each module was examined at various levels of module membership significance, with the P-values on the x-axis corresponding to the maximum significance thresholds for the Pearson correlation between the expression level of a gene and a module's eigengene (i.e., the first principal component obtained by singular value decomposition). The significance of enrichment was calculated for each level of module membership using the Fisher exact test (y-axis). The red line indicates significance at P < 0.05, whereas the red dotted line indicates significant enrichment after applying a Bonferroni correction for multiple comparisons. (B) Average correlation analysis. Average correlation between each module eigengene (Oldham et al. 2008) and the expression levels of genes associated with neuronal MR (NeuN+), non-neuronal MR (NeuN−), and all brain-expressed genes (all probes). Dagger indicates significant difference (P < 0.05, one-way ANOVA, followed by the Dunnet test using all brain-expressed genes [Iwamoto et al. 2005a] as reference). (NA) Functional characteristics were not assigned to that module.

