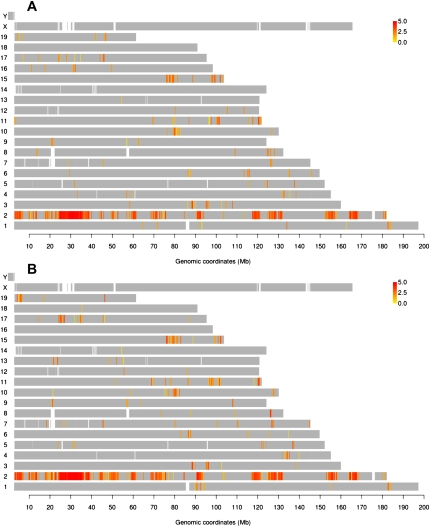
Figure 1.
Lcn2 is engaged with genomic loci in cis and in trans across the mouse genome before and after induction by Dex. Genomic map of Lcn2 contacts before (A) and 1 h after induction by Dex (B). Probes with P-values above the threshold (p score = −log10 p > 4: 0.3% FDR) are labeled in a yellow-to-red color scale according to the intensity of the probe signal (log2 4C/genomic DNA). (Gray) Probes with P-values below the threshold.

